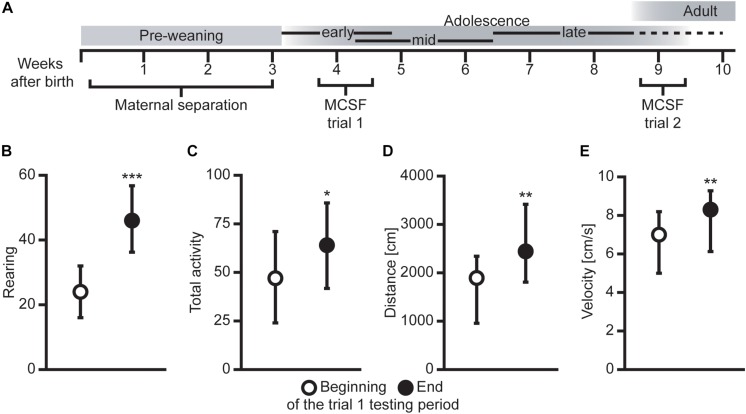
FIGURE 1.
(A) Overview of the experimental outline with age in weeks and approximate developmental stages [adopted from Lundberg et al. (2019) with permission]. Difference in (B) rearing, (C) total activity (i.e., sum of all frequencies), (D) total distance traveled (cm), and (E) mean velocity (cm/s) between animals tested in the beginning (first half, n = 39) compared to the end (second half, n = 32) of the MCSF trial 1 testing period. Data presented as median with upper and lower quartiles. *P < 0.05, **P < 0.01, ***P < 0.001, Mann–Whitney U test.

