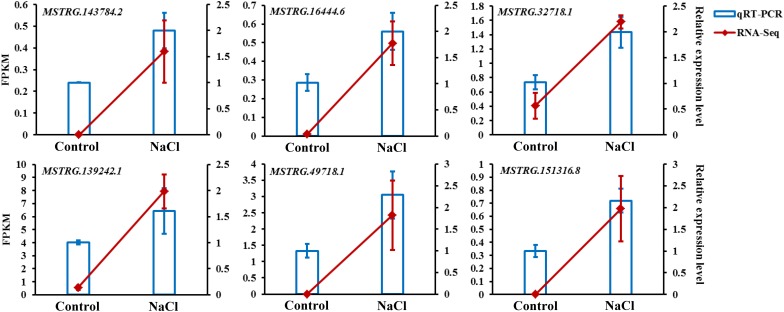
FIGURE 8.
qRT-PCR validation of six DE-lncRNAs selected from the RNA-Seq transcriptome. The expression levels of the RNA-Seq results were calculated using the FPKM value presented on the left axis; qRT-PCR relative expression levels were calculated using the 2– ΔΔCt method presented on the right axis; the values shown are the means ± standard deviation of n = 3 replicates.

