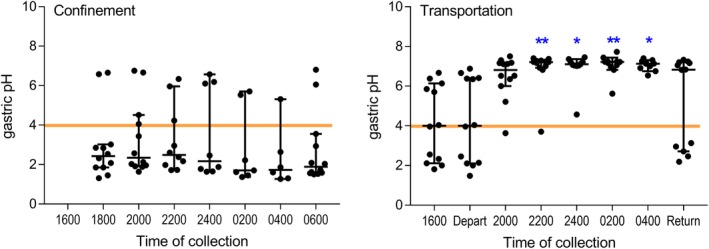
Figure 3.

pH results for gastric fluid (GF) aspirated every 2 hours via indwelling nasogastric tubes from 12 horses during confinement (left) and transportation (right). Results are shown as median (horizontal bar) and range (whiskers), with all available data shown. Transportation, but not confinement, was associated with significantly increased pH of GF, with results significantly greater than obtained at departure shown (**P < .01; *P < .05)
