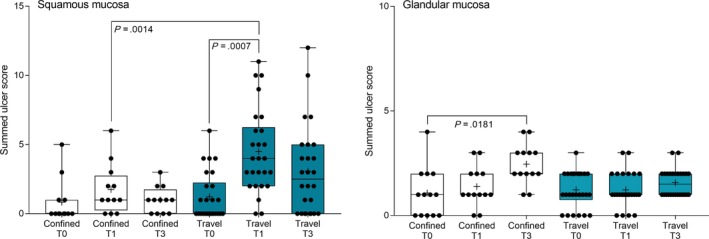
Figure 4.

Summed squamous ulcer scores before (T0), immediately after (T1), and 60 hours after (T3) overnight confinement or transportation. Median squamous score increased after transportation (blue), but not after confinement (white), with significant differences observed between T0 and T1 for transported horses, and at T1 when transported horses were compared with confined horses. A minor effect on glandular ulcer score was observed in confined horses (white), but transportation had no effect on glandular ulcer scores (blue). Results are shown as median (horizontal bar), mean (cross), quartiles (box), and range (whiskers), with all data points shown. Significant differences are shown
