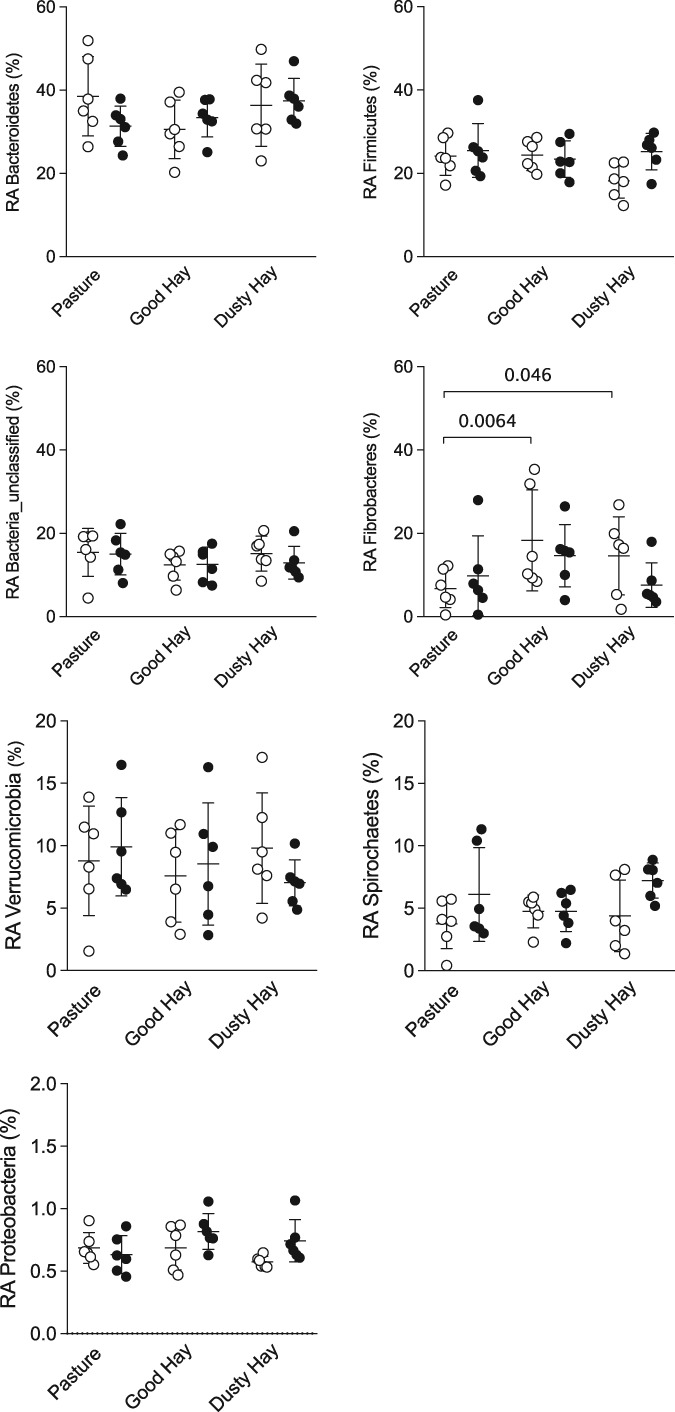
Figure 2.

Relative abundance (RA) of the seven most common phyla by group and environment. Open circles: 6 healthy horses. Black circles: 6 horses with asthma. Bars represent mean and SD. For Fibrobacteres, there was an overall significant effect of the environment (P < .01), and a significant increase when horses were fed hay compared to pasture. Repeated measure ANOVA were done on log‐transformed data, followed by uncorrected Fisher's LSD
