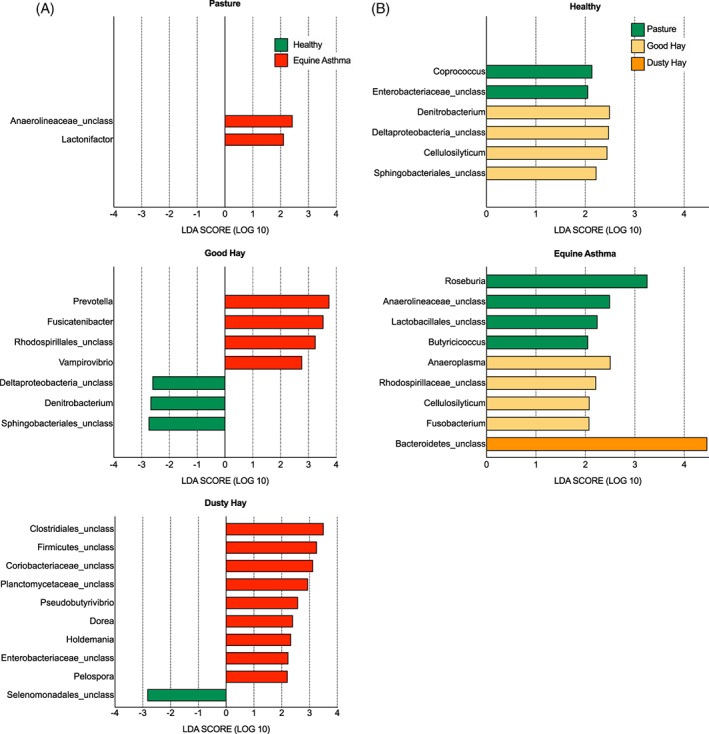
Figure 4.

Linear discriminant analysis effect size (LEfSe) analysis. A, LEfSe analysis showing genera that were significantly differentially abundant between groups (healthy in green, equine asthma in red). B, Environments (pasture in green, good hay in yellow, dusty hay in orange) (all LDA scores >2). LDA, linear discriminant analysis; Unclass, unclassified at the genus level
