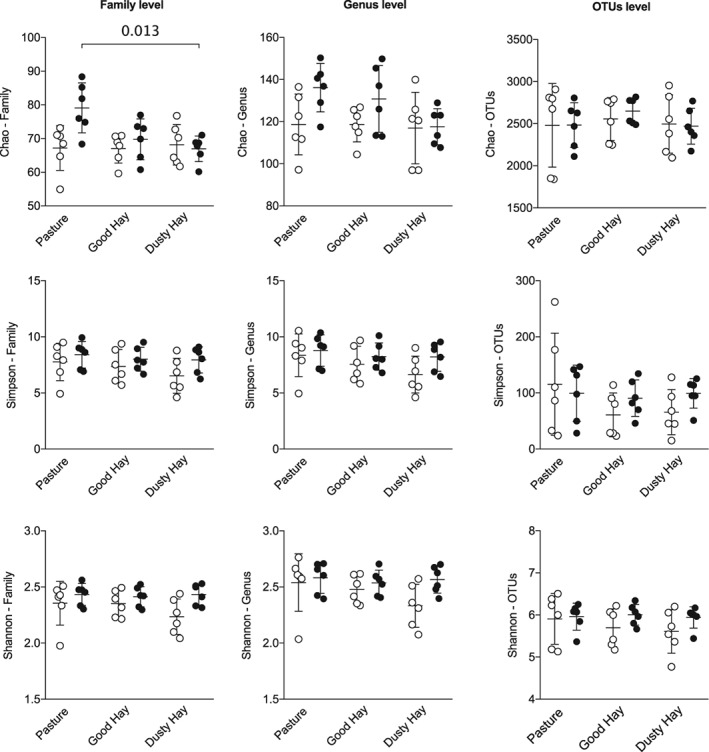
Figure 5.

Indices of alpha diversity at the family, genus, and species level of taxonomy. Open circles: 6 healthy horses. Black circles: 6 horses with asthma. Bars represent mean and SD. At the family level, there was an overall significant interaction effect for the Chao index (P = .02, 2‐way ANOVA on log‐transformed data), with a significant decrease of richness between pasture and dusty hay (P = .01, uncorrected Fisher LSD) and a significant group effect for the Shannon index (P = .02). Fisher's LSD did not show significant pair‐wise comparisons and the differences observed at the family level were not found at the genus or species levels
