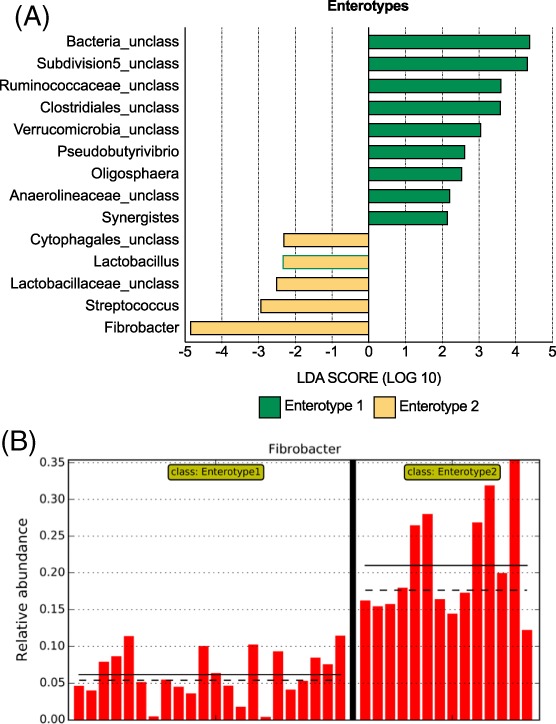
Figure 8.

Linear discriminant analysis effect size (LEfSe) analysis. A, LEfSe analysis showing genera that were significantly differentially abundant between enterotype 1 (“pasture enterotype”) and enterotype 2 (“hay enterotype”). All LDA scores >2. B, Relative abundance of fibrobacter, the major discriminant between the two enterotypes. Straight lines represent the mean, dotted lines represent the median. LDA, linear discriminant analysis; Unclass, unclassified at the genus level
