
Figure 1.
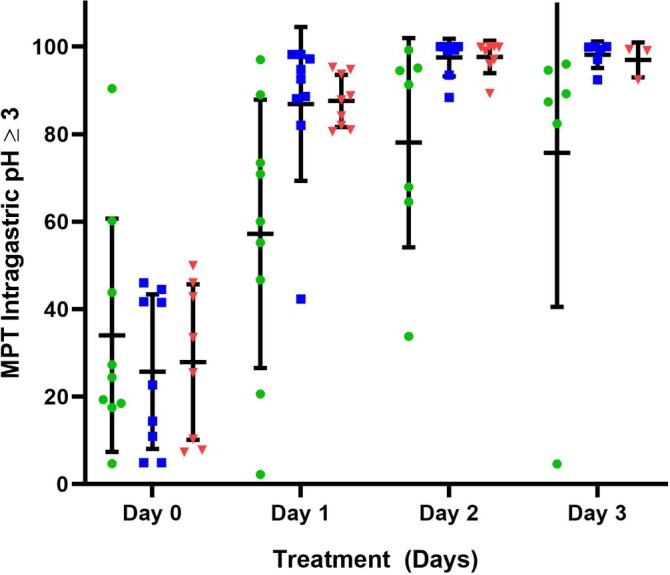
The mean percentage time (MPT) intragastric pH ≥3 for all dogs receiving 1 mg/kg q12h esomeprazole, pantoprazole, and 8 mg/kg/day famotidine constant rate infusion (CRI) on treatment days 1‐3. Horizontal and vertical lines represent the mean and standard deviations, respectively. Individual dog data are represented by green circles (pantoprazole), blue squares (esomeprazole), and red triangles (famotidine CRI). Significant increases in MPT intragastric pH ≥3 were noted over time (P = .001) with all 3 treatments. No significant treatment (P = .56) or treatment‐by‐time interaction (P = .56) were observed