
Figure 2.
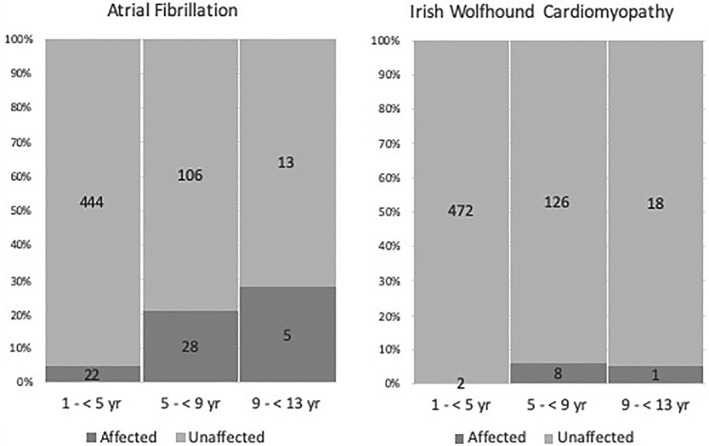
Age‐dependent prevalence of atrial fibrillation (left) and Irish Wolfhound cardiomyopathy (right). The x‐axis consists of ordinal categories of age and the y‐axis represents prevalence expressed as percent. Numerical values are the absolute counts of affected and unaffected Irish Wolfhounds in each age category