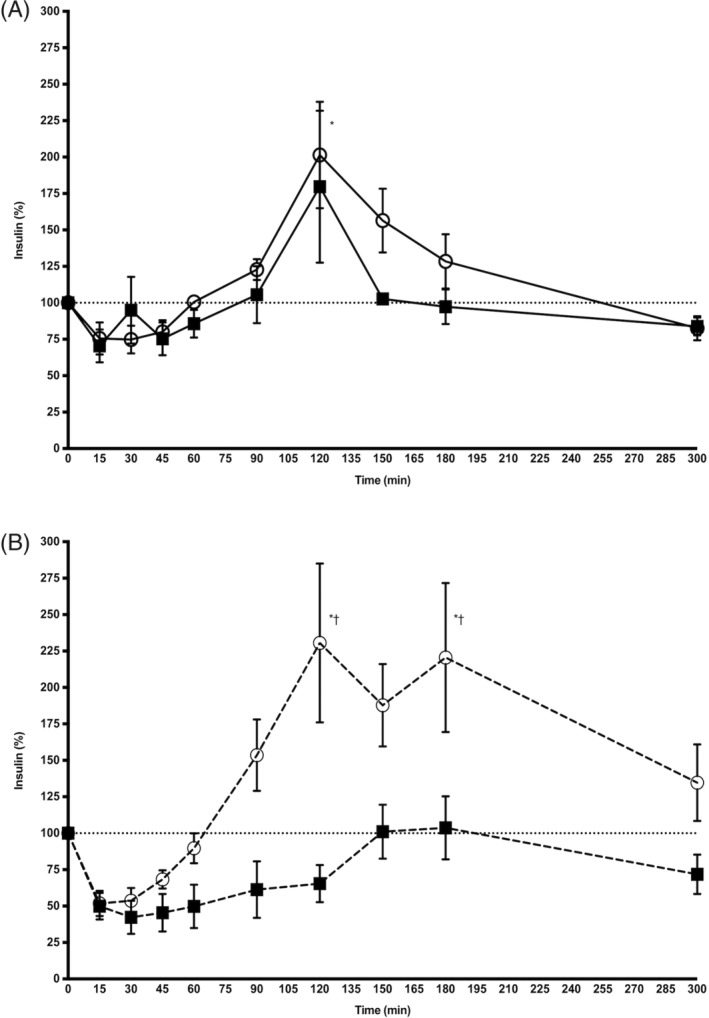
Figure 2.

Mean (± SD) insulin concentration (percentage of baseline) after IV administration of xylazine hydrochloride (open circles) and detomidine hydrochloride (black squares) in 7 control horses (solid line, panel A) and 7 insulin dysregulated horses (dashed line, panel B). *P < .05 versus baseline; †P < .05 xylazine versus detomidine
