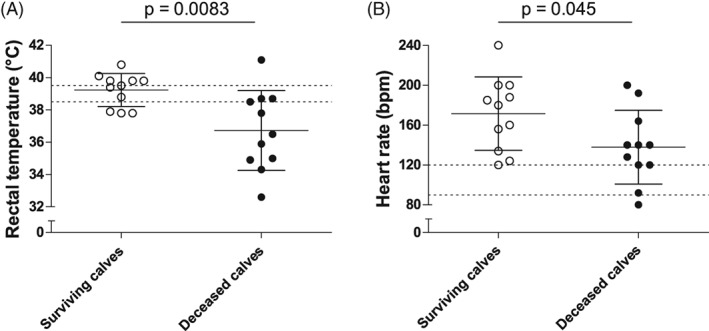
Figure 1.

Summary of the univariate analysis of the different parameters that were significantly different between calves with positive or negative outcomes based on the short‐term outcome. Vertical scatter plot representation of the available admission values of the vital parameters that were significantly different between the surviving (white) and the deceased (black) calves: rectal temperature (A, n = 22) and heart rate (B, n = 22). Individual values, means, SDs, and reference ranges are shown
