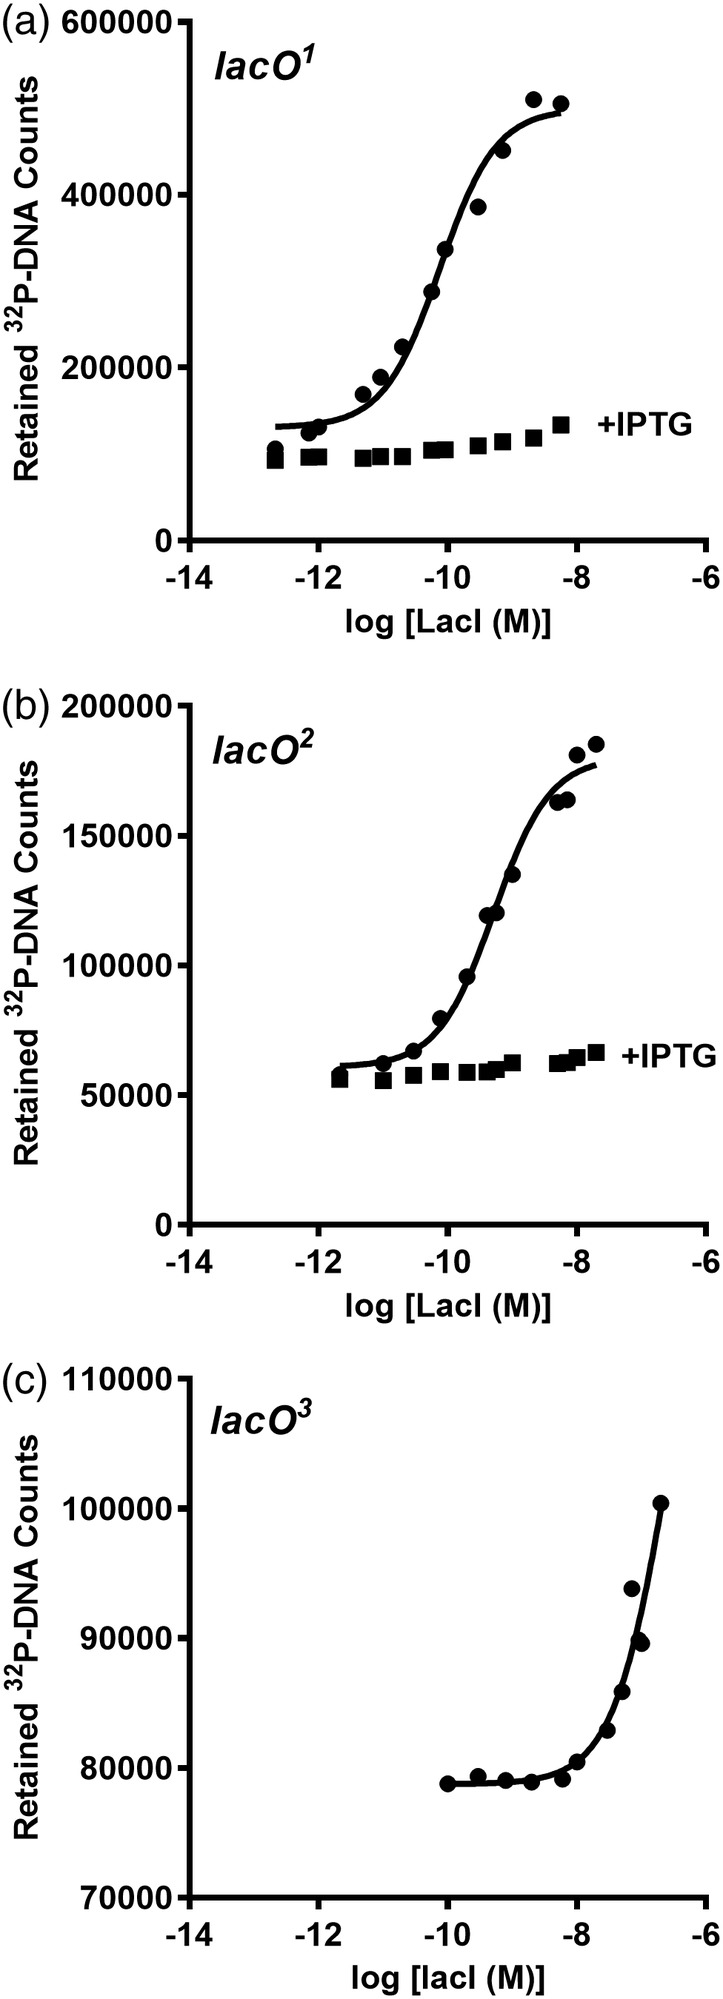
Figure 1.

LacI‐DNA binding assayed with filter binding. The filter binding assay was used to monitor LacI binding to (a) lacO 1, (b) lacO 2, and (c) lacO 3 in the absence (●) and presence (■) of 1 mM IPTG. In these experiments, DNA concentration was fixed at 3 × 10⁻¹² M. The solid line represents the best fit of Equation (1) and the values reported in Table 2 are the average and standard deviations of at least three independent experiments with at least two different protein preparations. Filter binding could not be used to determine K d values for the natural lacO 3 operator (c) because the filter was saturated with protein at concentrations above those shown. A lower limit for K d was estimated from the partial binding curve
