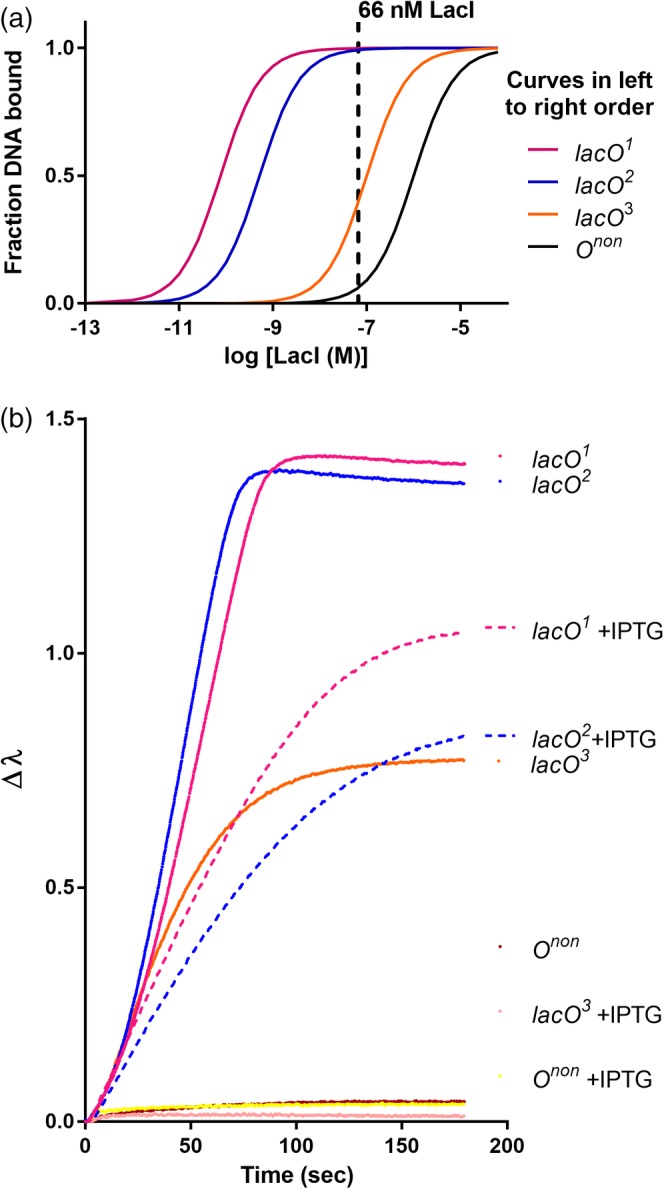
Figure 3.

The BLI signal at equilibrium correlates with the fraction of LacI bound to DNA operators. (a) Idealized equilibrium binding curves for LacI binding to different DNA sequences, using the K d values reported in Table 2 for lacO 1 and lacO 2 and estimated K d values of 10−7 M for lacO 3 and 10−6 M for nonspecific DNA (“Onon”; Table SII). The dashed vertical line illustrates how, at a given LacI concentration, each operator has a different percent of LacI bound. (b) BLI was used to monitor 66 nM LacI binding to the same operators, in the presence and absence of 1 mM IPTG inducer. The change in BLI signal (Δλ) was monitored as a function of time until equilibrium was reached. All biosensors were loaded to a similar density of immobilized DNA; for simplicity, the DNA immobilization step is not shown. As expected, signals for lacO 3 + IPTG and Onon ± IPTG and were extremely low in these conditions (bottom of the plot)
