
Figure 4.
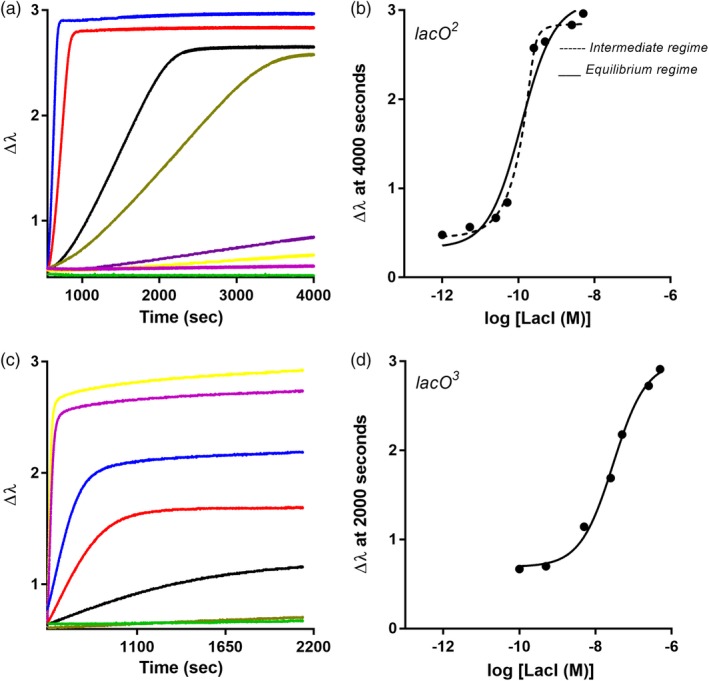
LacI‐DNA binding assayed with BLI. Biolayer interferometry was used to monitor LacI binding to (a,b) lacO 2, and (c,d) lacO 3 using an eight‐channel BLI instrument. Similar to filter binding assays, the concentration of LacI was varied (different color curves in a and c) and the DNA concentration was constant. In each experiment, DNA was loaded onto the BLI sensor tips from a solution of 80 nM; for simplicity, this step is not shown on the plot. When the repressor‐operator binding reactions reached equilibrium, plateau values at (a) 4,000 s and (c) 2000 s were plotted against log[LacI] to generate the titration curves shown in (b) and (d), respectively. Solid lines are the best fit of Equation (1) to the data, and the dashed line represents the best fit of Equation (2). The experiments shown are representative of at least three replicates with at least two different protein preparations