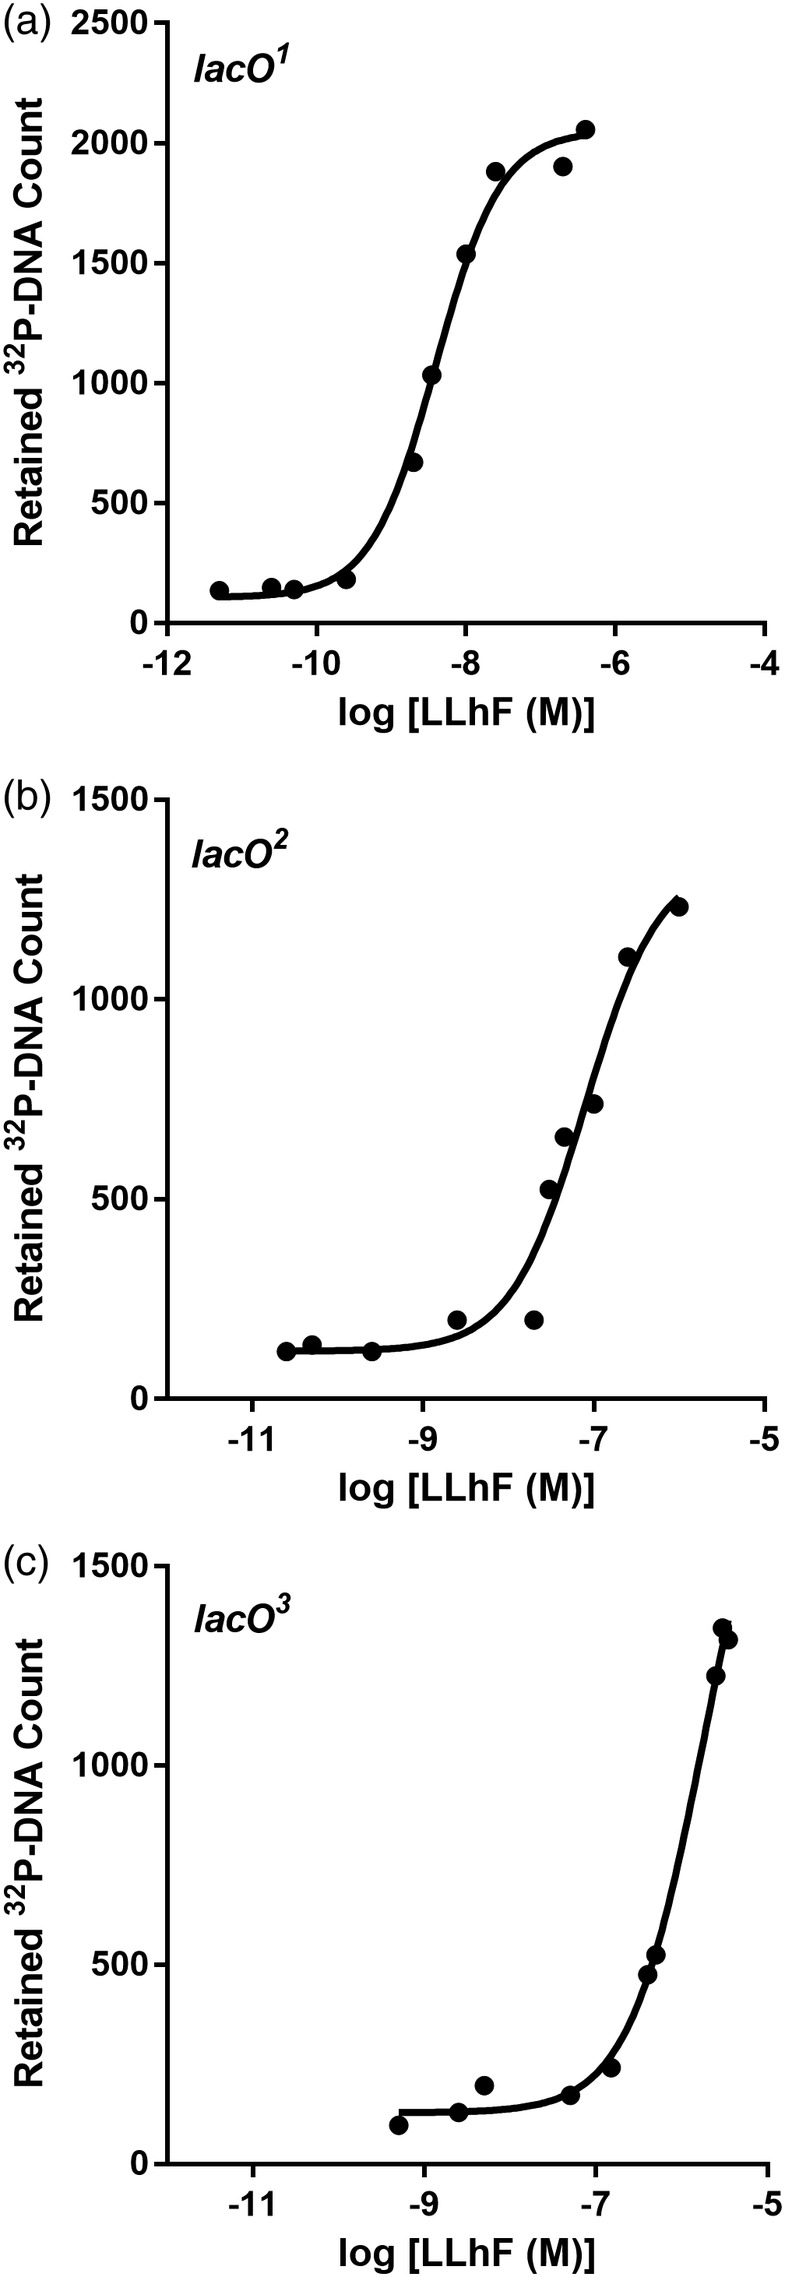
Figure 5.

LLhF‐DNA binding assayed with filter binding. The filter binding assay was used to monitor LLhF binding to (a) lacO 1, (b) lacO 2, and (c) lacO 3. In these experiments, DNA concentration was fixed at 3 × 10 −12 M. Only partial binding curves could be obtained for lacO 3 due to limitations on the LLhF concentration that could be obtained from a single protein preparation; this partial curve was used to determine a lower limit for K d. The curves shown are representative of at least three replicates with at least two different protein preparations. The solid lines are the best fit of Equation (1) to the data
