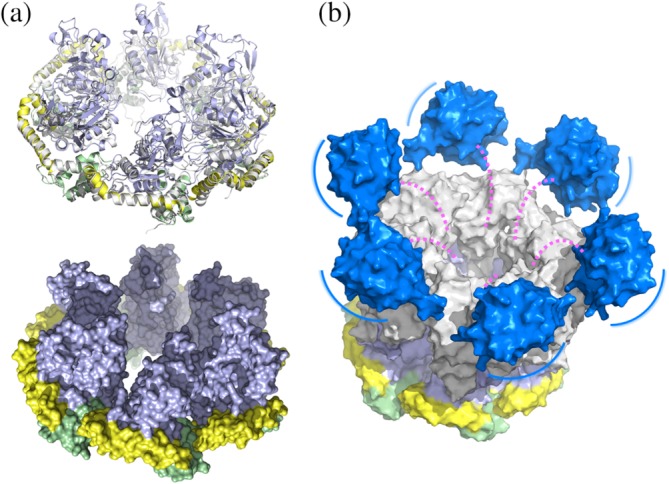
Figure 3.

Model of the ChlI–ChlD complex. (a) Superimposition of each BchI protomer (shown in a similar color scheme as in Figure 2) onto the ChlI hexamer (gray) in ribbon (upper panel) and surface (lower panel) representations. The surface of ChlI is not shown. (b) Schematic model of the ChlI–ChlD double hexamer. ChlI is colored as in a. The ChlD N‐terminal domain and C‐terminal integrin I domain, constructed by the SWISS‐MODEL server then aligned onto the planar ChlI, are colored in gray and blue, respectively. The double hexamer model was generated by manually placing the ChlD N‐terminal hexamer atop the ChlI hexamer with maximum interface. The possibly unstructured middle proline‐rich region is represented as dashed magenta lines. The blue lines indicate position movements of the integrin I domains on the periphery of the double ring structure
