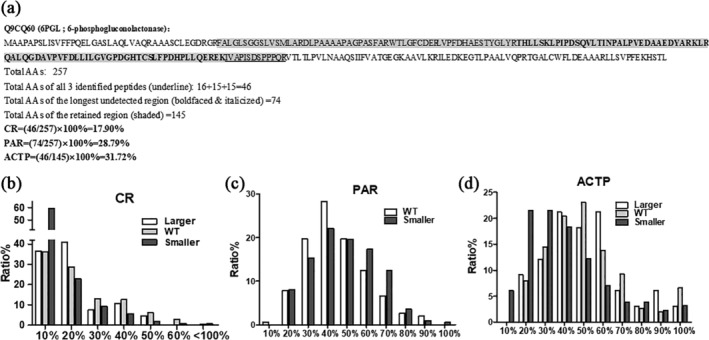
Figure 8.

Calculation of CR, PAR, and ACTP, as well as their distributions with the Y axis being the percentage of the genes detected and the X axis being the CR, PAR, or ACTP. (a) Methods of calculation of CR, PAR, and ACTP with the 6PGL protein as the example. (b) CR distribution, showing that in all three groups the majority of the proteins detected have a CR of about 20% or less. (c) PMCUF distribution showing that in the WT‐ and smaller‐groups PMCUF tends to manifest a normal distribution, with most proteins having a PMCUF around 20–80%. (d) ACTP distribution showing that in all three groups ACTP tends to distribute normally, with most proteins having an ACTP around 20–70%
