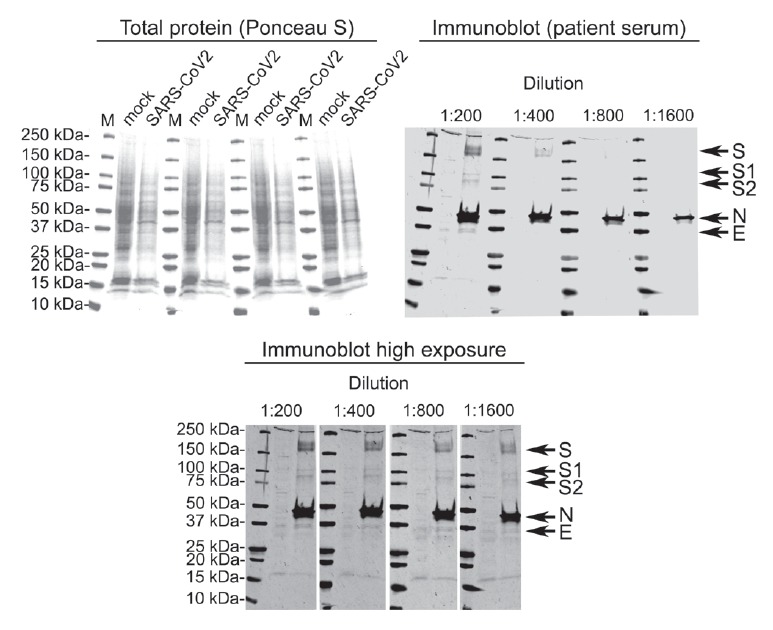
Figure 3.
Western blot of mock- and SARS-CoV-2 infected Vero E6 cells using patient serum collected 20 days after onset of symptoms, Finland, January–February 2020
Top left panel: total protein staining (Ponceau S) of the nitrocellulose membrane before probing. Top right panel: strips probed with different dilutions of the patient serum at low exposure. Bottom panel: the same membranes individually contrasted for higher band intensity. The arrows indicate SARS-CoV-2 proteins, the labelling assumes that the migration of SARS-CoV-2 proteins was similar to that of Vero E6-expressed SARS-CoV proteins [23]. The bands migrating at ca 110 and 90 kDa probably represent S1 and S2, respectively. Marker M: Precision Plus Dual Colour Standards (Bio-Rad). The detection was done using Odyssey Infrared Imaging System (LI-COR) using goat anti-human IR800 conjugate at 1:10,000 dilution.

