
Figure 1. Examples of positive selection at the host–pathogen interaction surface.
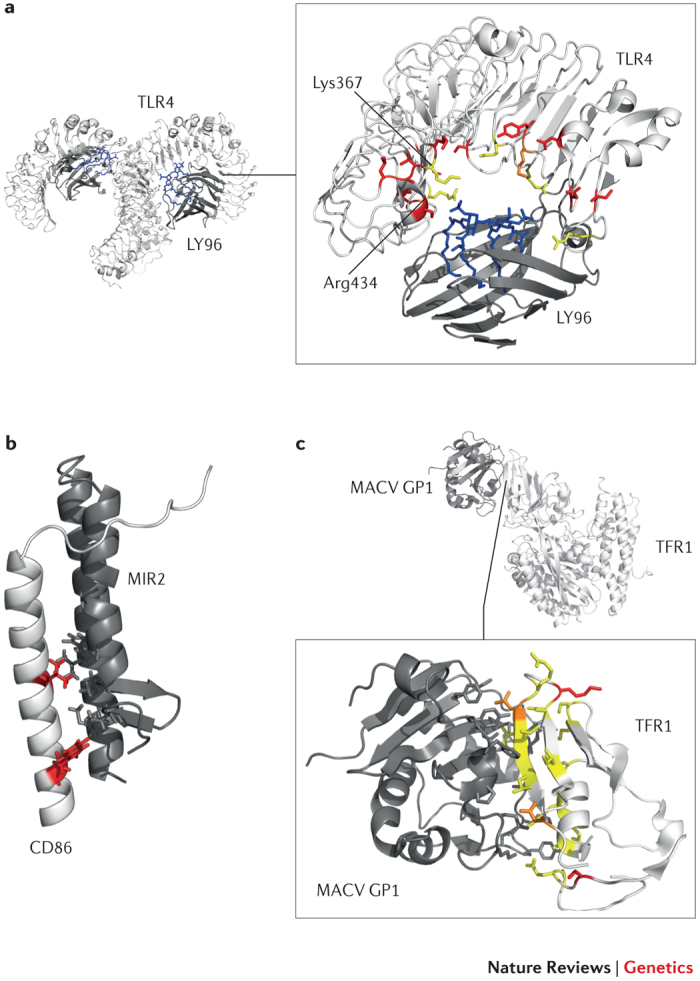
As discussed in Box 1, regions at the host–pathogen contact interface are expected to be targeted by the strongest selective pressure. Three examples are shown here. a | Detail of the Toll-like receptor 4 (TLR4)–lymphocyte antigen 96 (LY96)–lipid IVa complex. Mouse TLR4 and LY96 are in white and grey, respectively; lipid IVa is in blue. Sites that are positively selected in mammals35 are mapped onto the TLR4 structure (red): several of these flank or correspond (orange) to residues that differ between humans and mice and that surround the phosphate groups of lipid IVa (yellow)34. If Lys367 and Arg434 are replaced with the human residues (Glu369 and Gln436, respectively), the responsiveness of mouse TLR4–LY96 to lipid IVa is abolished. b | Structures of human CD86 (white; transmembrane and juxtamembrane region) and MIR2 (grey; encoded by Kaposi sarcoma-associated herpesvirus). CD86 sites that are involved in the interaction and that are positively selected in mammals are shown in red. c | Complex of transferrin receptor protein 1 (TFR1) with the surface glycoprotein (GP1) of Machupo virus (MACV), a rodent arenavirus that can also infect humans through zoonotic transmission. TFR1 residues involved in the interaction with GP1 are in yellow, positively selected sites are in red and positively selected sites that directly interact with GP1 are in orange.