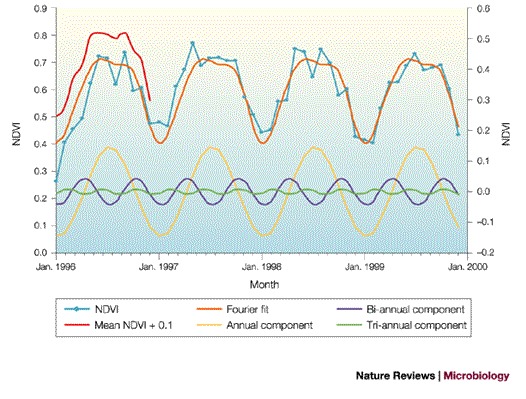
Figure 1. Normalized difference vegetation index signal from a point in central Wales, UK.

The monthly normalized difference vegetation index (NDVI) signal from a point in central Wales, UK (3.58°W, 52.34°N) for 1996–1999 is shown in light blue, the mean monthly signal for this period is shown in red (displaced vertically by 0.1 for clarity), the temporal Fourier fit to these data is shown in orange, and the annual, bi-annual and tri-annual components of this fit are shown in yellow, purple and green, respectively (right-hand scale). The temporal Fourier fit describes the average annual cycle at this site well.
