
Figure 3. Results of statistical modelling of the distribution of vectors and disease using selected temporal Fourier-processed images as predictor variables.
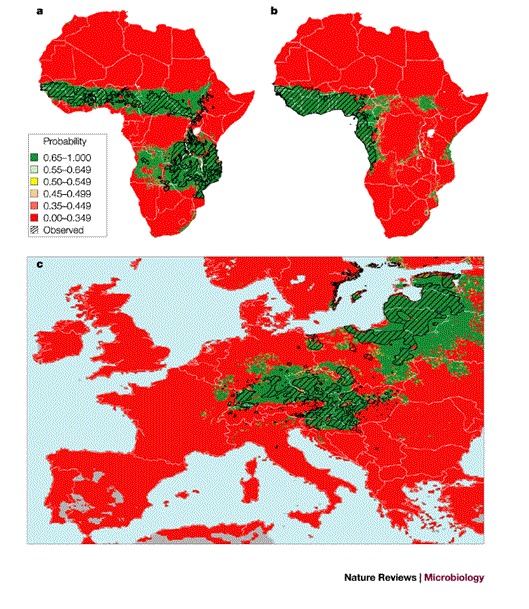
a | The distribution of Glossina morsitans (three subspecies) throughout Africa. b | The distribution of Glossina palpalis (two subspecies) in West Africa. c | The distribution of tick-borne encephalitis in Europe (historical mapped data is shown cross-hatched in black). The predicted habitat suitability for the vectors or disease are on a probability scale from zero (red) to 1 (green) (see inset for legend); (a) 91% correct with 7% false-positives (that is, false predictions of presence) and 2% false-negatives (that is, false predictions of absence); sensitivity 0.96, specificity 0.857; (b) 96% correct with 3% false-positives and 1% false-negatives; sensitivity 0.97, specificity 0.94; (c) 90.5% correct with 8.1% false-positives, 1.4% false-negatives; sensitivity 0.966, specificity 0.865. Modified with permission from Refs 40,41 © (2000) Elsevier Science.