
Figure 4. Biological models driven by remotely sensed data.
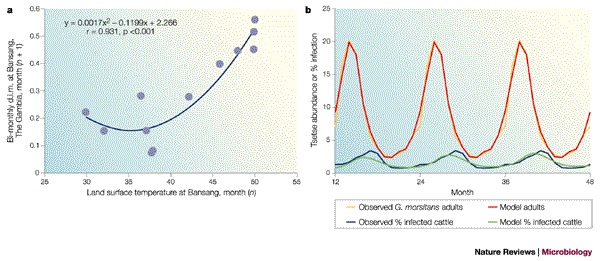
a | The relationship between the mortality rate of the tsetse Glossina morsitans submorsitans at Bansang, The Gambia, West Africa, and the satellite-derived land surface temperature for the previous month. Mortality is the two-point (previous, present month) smoothed density-independent mortality (d.i.m.) that is calculated from regular trapped samples of flies. b | A least-squares-fitted biological tsetse population model (red line), which is driven by satellite data by the relationship shown in (a), describes 93% of the variance of the observed mean monthly field data (yellow line). The fitted tsetse model was then used in a simple disease transmission model (lower, green line) and describes 62% of the variance of the observed field data (blue line). Field data are the average monthly values from the sample sites, and are repeated over a 3-year period in the figure for clarity. Modified with permission from Ref. 40 © (2000) Elsevier Science.