
Figure 5. The use of meteorological data averages to define ten climate zones in Great Britain.
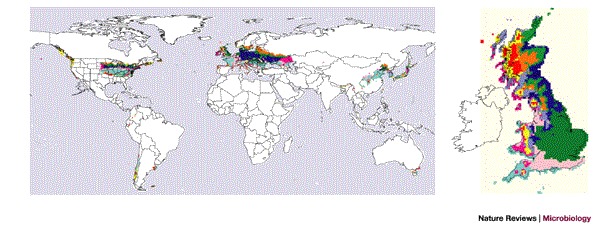
The mean, maxima and minima of temperature, rainfall and vapour pressure measurements from gridded meteorological data averages for 1961–1990 (Ref. 33) were clustered within an image-processing system (ERDAS Imagine © Leica Geosystems, ISODATA clustering) to define ten climate zones in Great Britain (see map on right, arbitrary colours). The global map shows how matches to these climate zones occur in Europe, North America and China, with smaller area matches elsewhere. White indicates no significant matching. Reproduced with permission from Ref. 42 © (2002). Crown copyright material is reproduced with the permission of the Controller of HMSO and the Queen's Printer for Scotland.