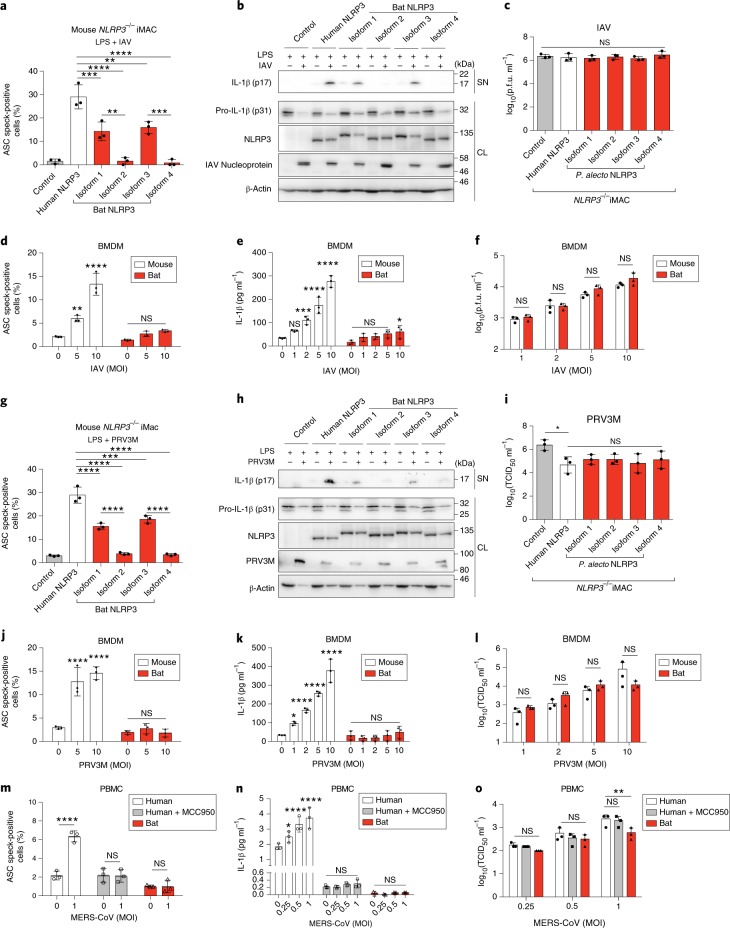
Fig. 5. Bat NLRP3-mediated inflammation in immune cells is dampened in response to IAV, PRV3M and MERS-CoV infection.
a–c,g–i, Quantification of ASC specks by ImageStream (a,g), immunoblot analysis (b,h) and virus titration (c,i) of mouse NLRP3−/− iMACs reconstituted with mCitrine alone (control), human or bat (P. alecto) NLRP3–mCitrine, primed with LPS for 3 h, followed by infection with IAV (MOI = 0.5, a–c) or PRV3M (MOI = 2, g–i) for 24 h. NLRP3, NLRP3–mCitrine stained with anti-GFP; PRV3M, PRV3M viral protein stained with polyclonal macaque serum; SN, supernatant; CL, cell lysates. Titres in the supernatant are expressed as p.f.u. ml−1. d–f,j–l Quantification of ASC specks by ImageStream (d,j), IL-1β secretion by ELISA (e,k) and virus titration (f,l) of mouse or bat BMDMs, primed with LPS for 3 h, followed by infection with IAV (MOI = 1–10, d–f) or PRV3M (MOI = 1–10, j–l) for 24 h. Titres in the supernatant are expressed as median tissue culture infectious dose (TCID50) ml−1 m–o, Quantification of ASC specks by ImageStream (m), IL-1β secretion by ELISA (n) and virus titration (o) of human or bat PBMCs, primed with LPS for 3 h, followed by infection with MERS-CoV (MOI = 0.25, 0.5, 1) for 24 h. MCC950 inhibitor was added 1 h before infection for human PBMCs. Titres in the supernatant are expressed as TCID50 ml−1. *P < 0.05, **P < 0.01, ***P < 0.001, ****P < 0.0001, NS, not significant, by one-way ANOVA (a,c,g,i) or two-way ANOVA (d–f and j–o) with Bonferroni’s multiple comparisons test. Exact P values are provided in Supplementary Table 5. Data are presented as mean + s.d. of three biological replicates (d–f and j–o) or three independent experiments (a,c,g,i), or representative of three independent experiments (b,h).

