
Figure 4. Development of mortality following exposure to VHSV in groups of fish injected with pcDNA3-BU1 (●) or with pcDNA3 (○) 11 days earlier.
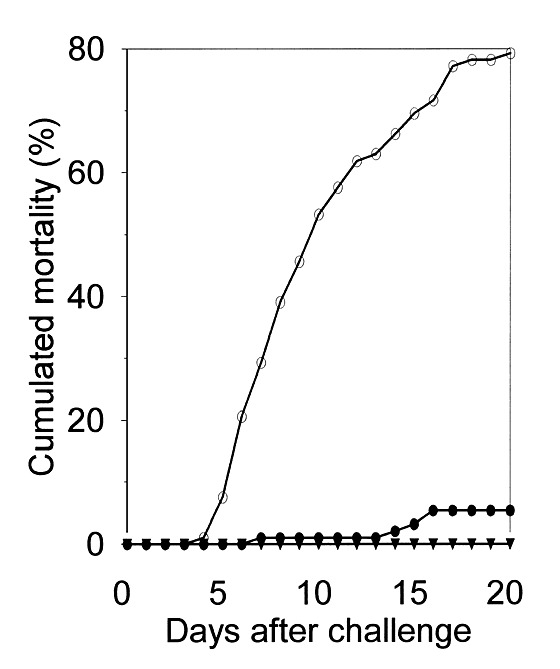
A mock-challenged mixed group of fish was included for determination of background mortality (▴). The graphs represent the mean of three replicate aquariums for each group.