
Figure 1. Visualizing a tyrosine kinase structure (PDB 1QCF)97.
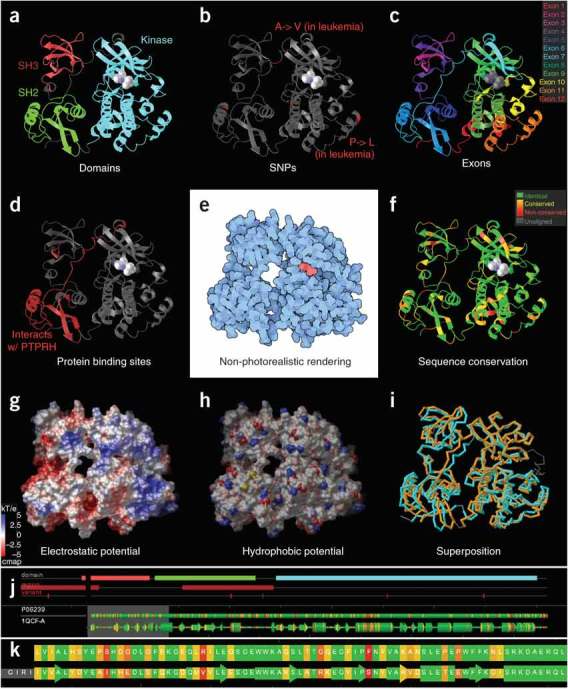
(a–d,f) A simple way to gain insight into function is to use ribbon representation colored by sequence features: for example, domains (a), SNPs (b), exons (c), protein binding sites (d) and sequence conservation (f). (e) An effective way to show overall shape is with nonphotorealistic rendering using flat colors and outlines. (g,h) Solvent-accessible surfaces are often used for displaying electrostatic (g) and hydrophobic potentials (h; hydrophilic in saturated colors and hydrophobic in white). (i) Superposition is commonly used to compare two or more related structures—for example, two distinct states of the same protein, or, as shown here, two separate proteins with similar structure (PDB 1QCF and 1FMK)98. (j,k) Increasingly many tools have an integrated, interactive sequence viewer, which helps users understand the relationship between sequence and three-dimensional structure. Images were made using SRS 3D7 (a–d,f,j,k), PMV25 (e,g,h) and RCSB PDB5 (i).