
Figure 3. Plotting host damage as a function of time.
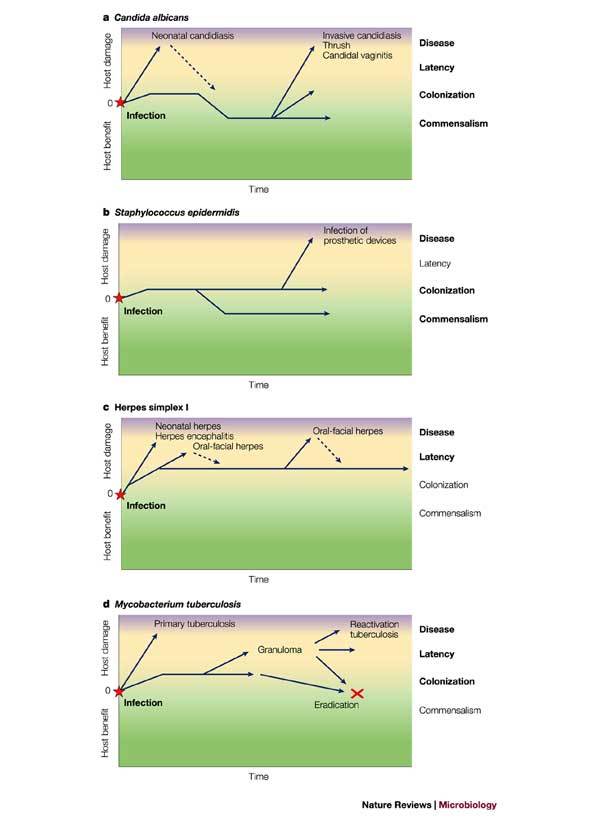
The host–microorganism interaction can be depicted by plotting host damage as a function of time. Panels a–d show how plotting damage versus time can be used to denote the states of the host–microorganism interaction for four different pathogens. Infection represents the acquisition of the microorganism by the host and is followed by the states of commensalism, colonization, latency and disease, depending on the amount of damage to the host2,5. These plots highlight the fact that for certain pathogens there is continuity between the various states. The colours green, yellow and purple denote health, disease and severe disease, respectively, and the relevant states for each host–microorganism interaction are highlighted in bold.