
Figure 3.
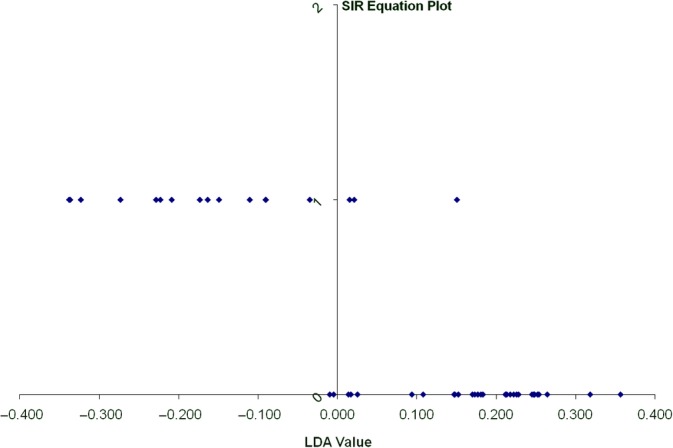
One dimensional sliced inverse regression plot showing classification of dogs into groups based on lipoprotein profile analysis. The vertical line represents the line that separates the two groups based on lipoprotein profile analysis. The linear discriminant analysis (LDA) value provides a ranking value for each dog. The dogs represented by the dots that are at the bottom of the graph are healthy (Group 2). The majority of dogs (except for 2 dogs) have a lipoprotein profile that plots to the right of the vertical line. The dogs represented by the dots at the top of the graph are dogs with pancreatitis (Group 1). The majority of these dogs (with the exception of 3) have a lipoprotein profile that is different from that of the healthy dogs. Sliced inverse regression analysis correctly classified approximately 90% of the dogs based on their lipoprotein profiles