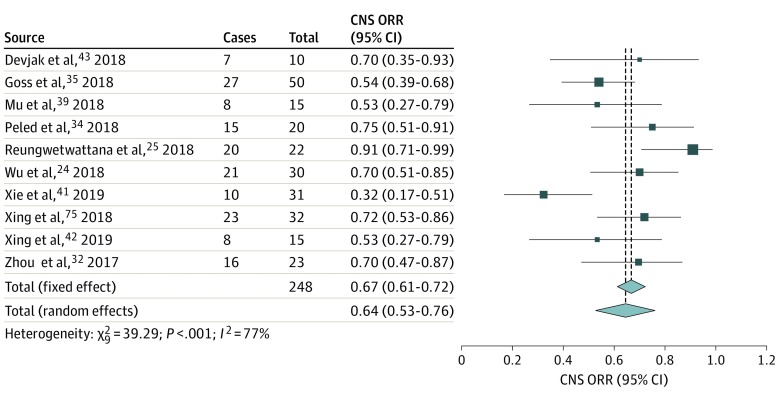
Figure 2. Forest Plot of Central Nervous System (CNS) Objective Response Rate (ORR).
The CNS ORRs were either taken directly from individual studies or calculated using reported numbers of responding and total treated patients. The size of each box represents the weight by the random-effects method of the contribution of each study to the weight of the sample in meta-analysis. The vertical dashed lines indicate the point of summary CNS ORRs, and the diamonds indicate the 95% CI for the summary CNS ORRs. Analyses using the inverse variance method were performed with the R programming language25,26,27 and the R packages metafor26 and meta.27

