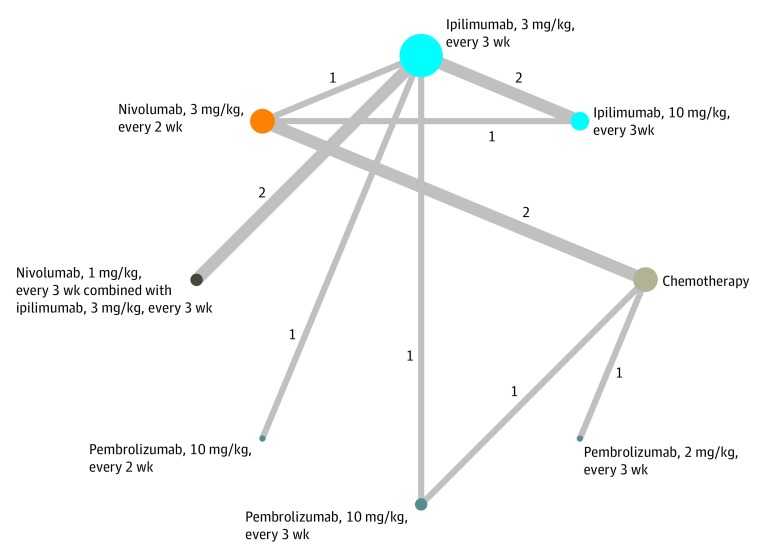
Figure. Network Diagram of 8 Treatment Regimens for Advanced Melanoma in 9 Trials.
Circular nodes indicate treatment regimens. The size of each circle corresponds with the number of participants, whereas the colors represent the types of treatment options. The width of the lines and the numbers next to these lines indicate the number of studies.

