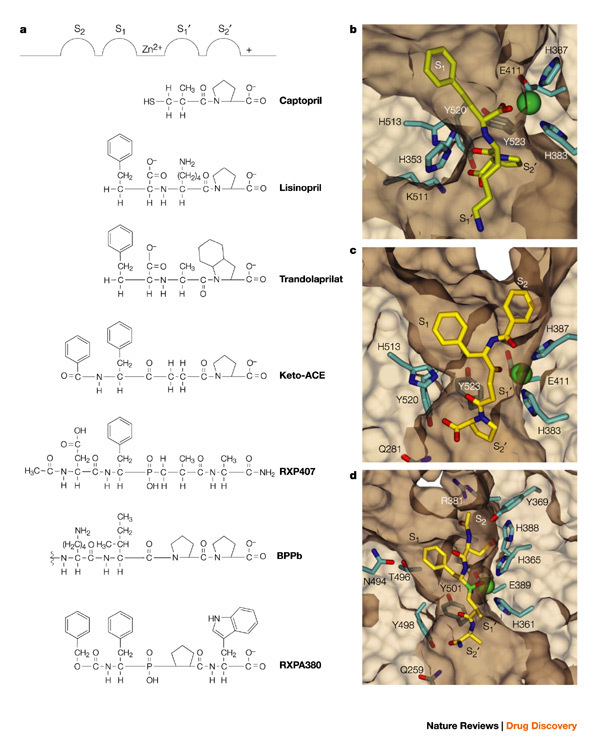
Figure 5. Models of interactions between inhibitors and the active sites of ACE.

a | Classical representation of inhibitor binding to the 'generic' ACE active site53,62. b–d | Three-dimensional structural representation of inhibitor-binding pockets in the tACE–lisinopril complex (b)5, the modelled tACE–keto-ACE complex (c) and the modelled N-domain–RXP407 complex (d). The different sub-sites are marked as in Fig. 5a. ACE, angiotensin-converting enzyme; tACE, testis ACE.
