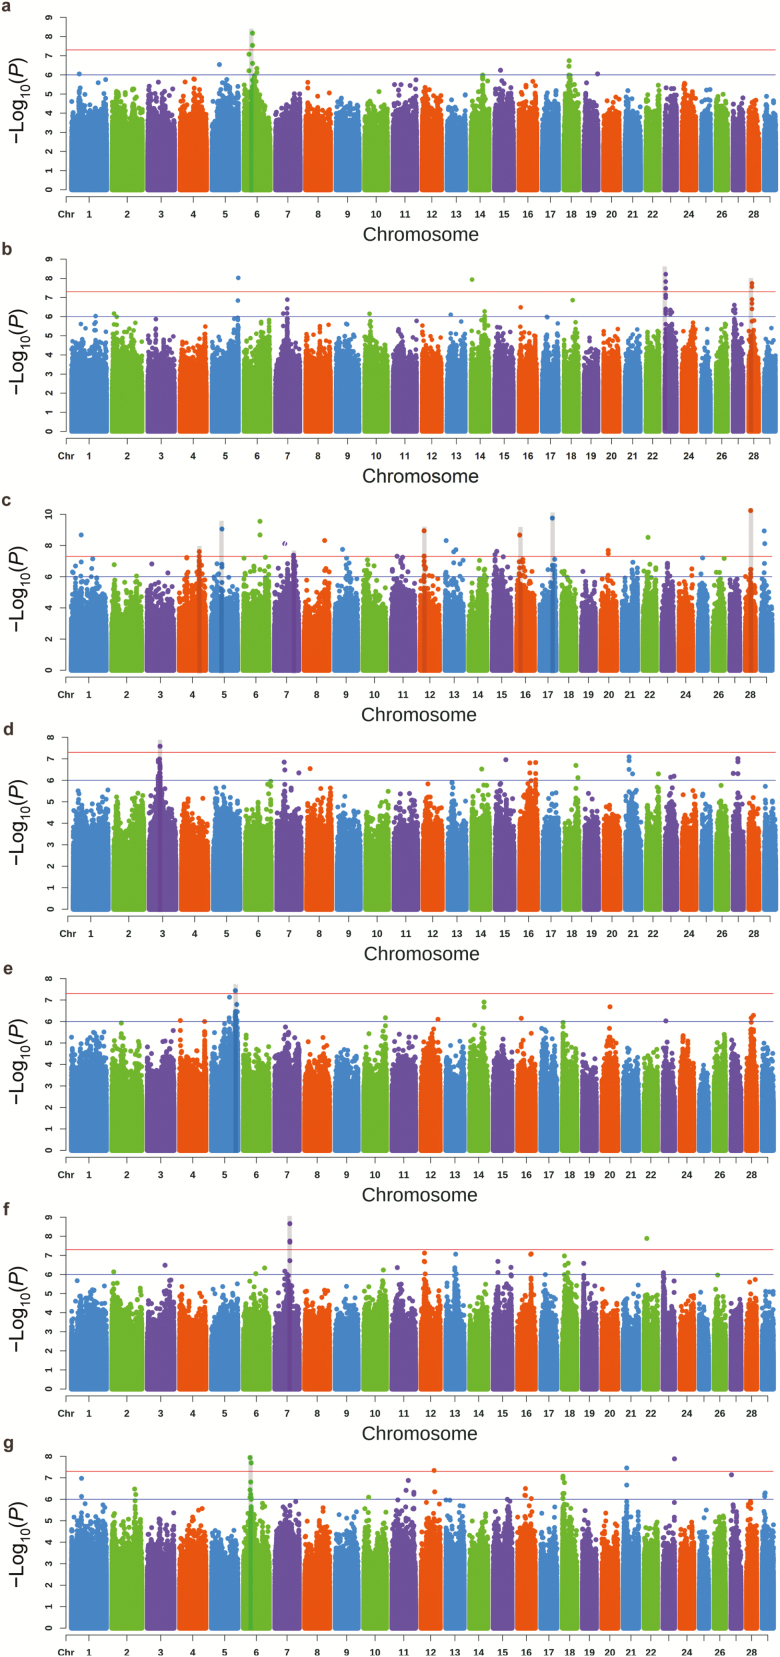
Figure 1.
Manhattan plots for ischium width (a), chest width (b), chest circumference (c), cannon circumference (d), body length (e), rump length (f), and chest depth (g). Red line and blue line indicate the significant threshold and suggestive threshold, respectively. The shading of each rectangle shows a significant association locus for body size.

