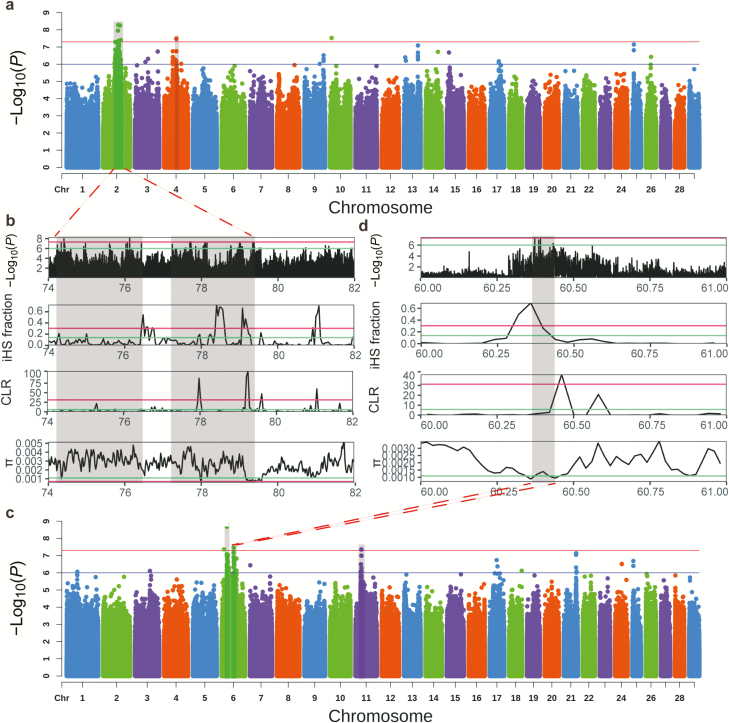
Figure 2.
Manhattan plots for hip cross height (a), forehead size (c), and selective signals on chromosome 2 (chr2:74 to 76 Mb) (b), and on chromosome 6 (chr6:60 to 61 Mb) (d) in Brahman cattle. In Manhattan plots, red line and blue line indicate the significant threshold and suggestive threshold, respectively. In selective signals, red line and blue line indicate top 1% and top 5% threshold in whole genome, respectively. The shading of each rectangle shows a significant association locus for body size. The selective signals were validated by iHS, CLR, and π (nucleotide diversity).

