
Figure 3. HIV-1 diversity in the worldwide epidemic.
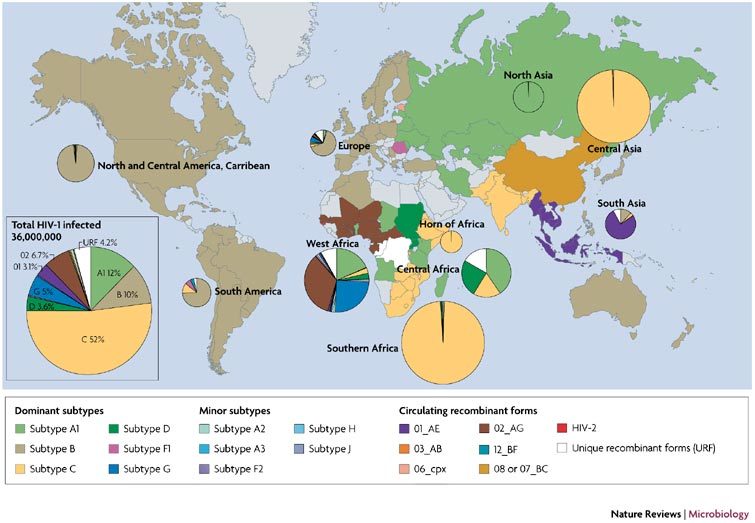
The frequency of each HIV-1 subtype and recombinant form was estimated in each country based on published findings. A complete breakdown of subtype prevalence per country and the countries present in each region are listed in the Supplementary information S1 (table). The countries are colour-coded based on the dominant HIV-1 group main (M) subtype. The countries coloured grey have a low level of HIV-1 prevalence or were not represented in the scientific literature related to HIV-1 subtype prevalence. The pie charts depict the proportion of each subtype or recombinant form in each geographical region. The size of the pies is proportional to the number of HIV-1 infected individuals in that particular region.