
Figure 2. Detecting SNP variation using microarrays.
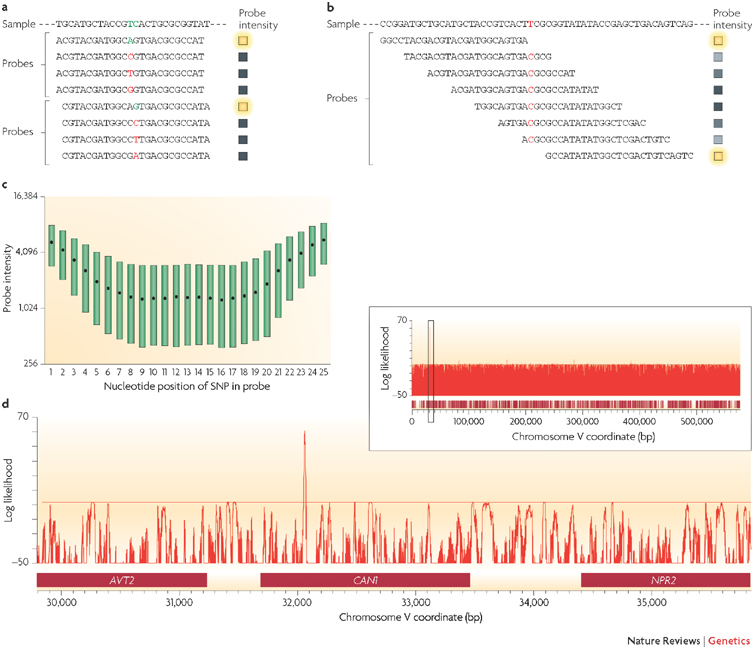
a | Resequencing microarrays are designed with short oligonucleotides in which every possible variant is represented at the central position of a probe (shown in coloured font). At least four probes are used to interrogate each nucleotide position (as shown here for two adjacent positions), but often eight or more are used to include both strands and other small insertions and deletions. The probe sequence that is exactly complementary to the sample will result in the greatest hybridization efficiency (indicated by a green letter) and thus a comparison among all probes can be used to determine the nucleotide sequence of the sample. The coloured boxes indicate the relative intensity of hybridization at each probe — yellow being the highest intensity. b | In the absence of resequencing arrays, hybridization of the sample to candidate sequence probes can be used. Mismatches resulting from mutations in sample DNA will result in a lower hybridization efficiency compared with hybridization to a sample with complete sequence complementarity. This approach has the advantage of requiring far fewer probes and is often sufficient to detect sequence variation. If a mismatch is inferred then small-scale sequencing is necessary to identify the variant nucleotide. c | The effect of a SNP on hybridization is related to its corresponding position in a probe. More central positions result in the greatest decrease, whereas SNPs positioned at the end of probes are much less likely to result in a significant decrease in hybridization. d | It is possible to use hybridization data obtained from a mutation detection array to compute a likelihood that a particular site is a sequence variant with respect to the reference genome. This approach facilitates the comparison of related individuals at the sequence level, allowing rapid scanning of the genome. The diagram illustrates the analysis of a drug-resistant mutant in the budding yeast, Saccharomyces cerevisiae. Candidate SNPs are identified by a positive log likelihood value. In this case, a small number of candidate SNPs are detected throughout the genome; one is shown here on chromosome V, which is representative of the entire 13 Mb of the yeast genome. The peak highlighted in the inset is shown at higher resolution in the main figure. A single signal in the CAN1 gene, which is known to confer resistance to the drug canavanine, was identified and subsequently verified using Sanger sequencing. AVT2, amino acid vacuolar transport 2; NPR2, nitrogen permease regulator 2. Images for parts c and d use data originally published in Ref. 31.