
Figure 3. Genome-wide mapping of loci by selective enrichment and detection using microarrays.
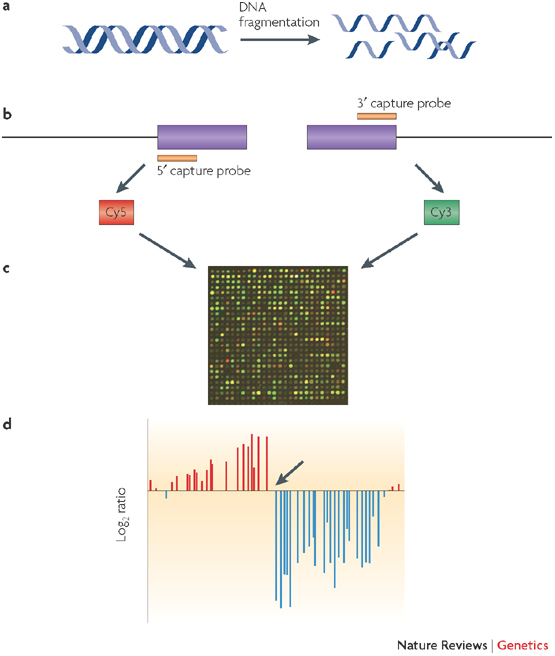
One way of mapping insertion sequence variation is to isolate the insertion element and its immediately neighbouring DNA. Specific regions of the genome are isolated using either a capture probe method (as illustrated in the diagram) or a PCR-based method. This approach is suited to mapping the location in the genome of mobile genetic elements, which are notoriously difficult to characterize using whole-genome sequencing approaches. As shown in the figure, DNA is fragmented in the first step (a). Two separate reactions selectively enrich for the 5′ and 3′ ends of the insertion sequence using sequence-specific capture probes (b). The 5′-enriched and the 3′-enriched fractions are labelled with different fluorophores (Cy5 and Cy3, respectively) and then hybridized to a microarray using a two-colour protocol (c). Finally, insertion sites are mapped on the basis of a transition (indicated by an arrow in d) from positive to negative log2 ratio, corresponding to sample that is enriched for DNA adjacent to the 5′ end of the insertion sequence and sample that is enriched for DNA adjacent to the 3′ end of the insertion sequence, respectively. The site of transition corresponds to the genomic location of the insertion sequence. Each red and blue bar represents a microarray probe in a contiguous region of the genome spanning ∼10 kb. The distance between each probe is ∼200 bp and therefore, in this case, the insertion site is detected between two probes corresponding to a mapping resolution of ∼200 bp.