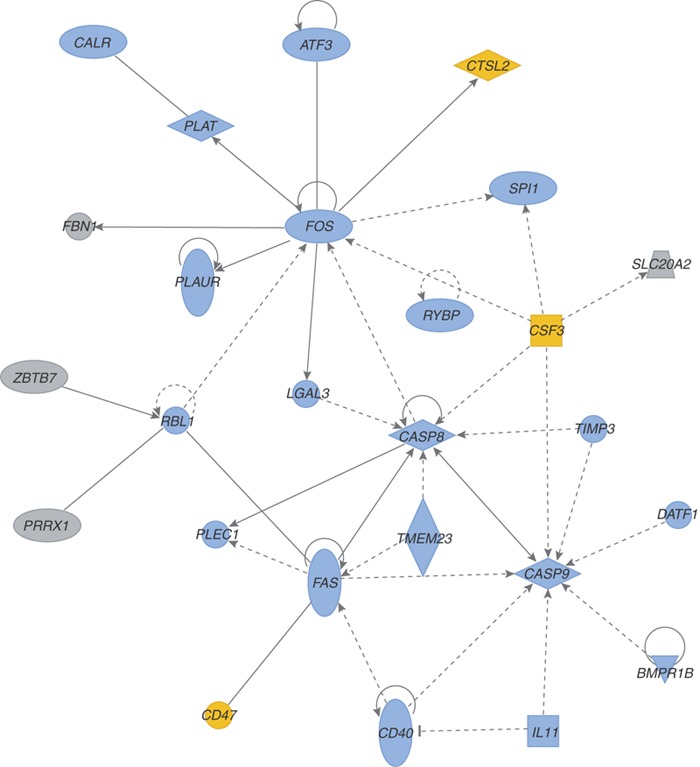
Figure 3. Functional relationships of activated of cell death responses during r1918 influenza virus infection.

Biological network of selected genes that were induced at least twofold (P < 0.01) in r1918-infected mouse lung as compared with uninfected controls. This diagram shows the direct (solid lines) and indirect (dashed lines) interactions reported for these cell death– (blue shading) and immune response–related genes (yellow shading); gray denotes genes with multiple and/or undefined biological function. Biological network analysis was performed using the Ingenuity Systems (Redwood City, CA) Ingenuity Pathway Analysis program and showed statistical significance when assessed using Fisher's exact test, which was used to calculate a P value determining the probability that each biological function and/or disease assigned to that dataset was due to chance alone.
