
Figure 4. Glycan microarray analysis of human H1, human H3, avian H5 and duck H3 influenza virus haemagglutinins.
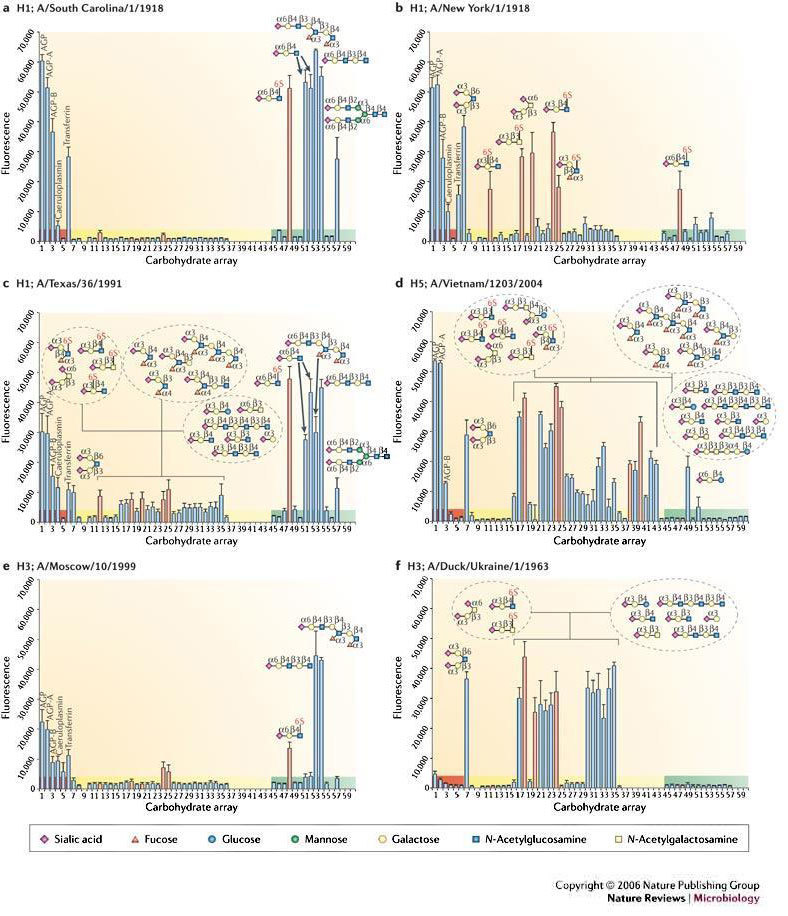
Glycan binding analyses as measured by fluorescence intensity are presented for natural haemagglutinins (HAs) from influenza viruses circulating during the 1918 pandemic (A/South Carolina/1/1918 (a) and A/New York/1/1918 (b)), a human H1 (A/Texas/1991) (c), an avian H5 originally isolated from a 10-year-old Vietnamese boy who died from bird flu (A/Vietnam/1203/2004) (d), a human H3 (A/Moscow/10/1999) (e) and a duck H3 (A/Duck/Ukraine/1963), the probable progenitor of the pandemic 1968 Hong Kong virus (f). Binding results for glycoproteins (highlighted in red), α2-3-linked sialosides (highlighted in yellow) and α2-6-linked sialosides (highlighted in green) are shown. The bars corresponding to signals generated by binding to sulphated or additional negatively charged glycans are coloured red. Owing to continual glycan microarray development, a number of new ligands were printed for the analysis of A/Vietnam/1203/2004 HA. Therefore, binding to glycans 37–44 and 58–60 was not determined, except for the A/Vietnam/1203/2004. Cartoon representations of the glycans bound to different spots on the array (numbered 1 to 60) are shown. AGP, α1-acid glycoprotein. Data adapted from REF. 63 and REF. 65.