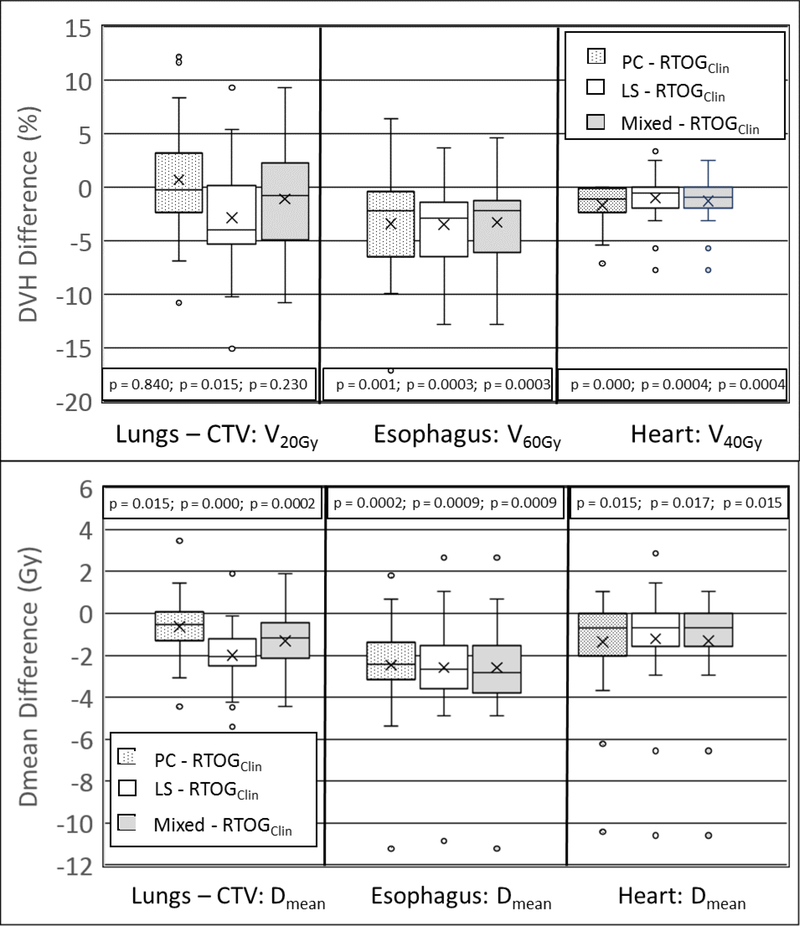
Figure 3:
Dosimetric differences between the PC, LS, and mixed KBP plans and the clinical RTOG 0617 plans at study defined dosimetric endpoints. Negative values indicate lower DVH values in the KBP plans. The outer bounds of the box represent the first and third quartiles, the median is represented by the middle line and the mean value illustrated by the “x”.
Maximum/minimum values within 1.5 times the inter-quartile range (Q3 – Q1) are represented by the upper/lower error bars, with outliers given by circles.

