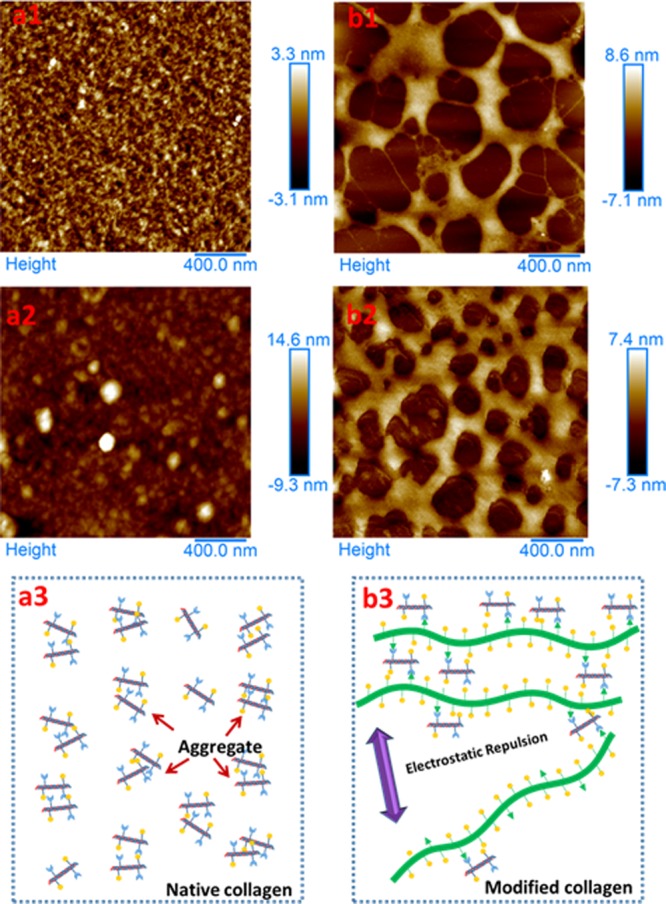
Figure 6.

AFM images of aqueous native collagen with concentration of 20 (a1) and 400 μg/mL (a2) and aqueous Col-PAA(2/1) with concentration of 20 (b1) and 400 μg/mL (b2); schematic illustrating the aggregation behavior of the native collagen (a3) and the modified collagen (b3). Bars in images indicate 400 nm.
