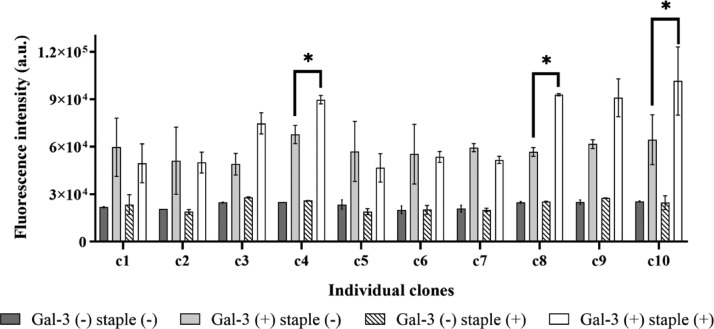
Figure 2.
Phage-based ELISA results. The gray solid and black strip bars indicate the fluorescence intensity of non-stapled and stapled phage clones to the microplate without Gal-3 (Gal-3(−)), respectively. The light gray solid and white solid bars indicate the fluorescence intensity of non-stapled and stapled phage clones to the Gal-3-immobilized microplate (Gal-3(+)), respectively. For all samples, n = 3; the error bars represent the standard deviation. *p < 0.05.

