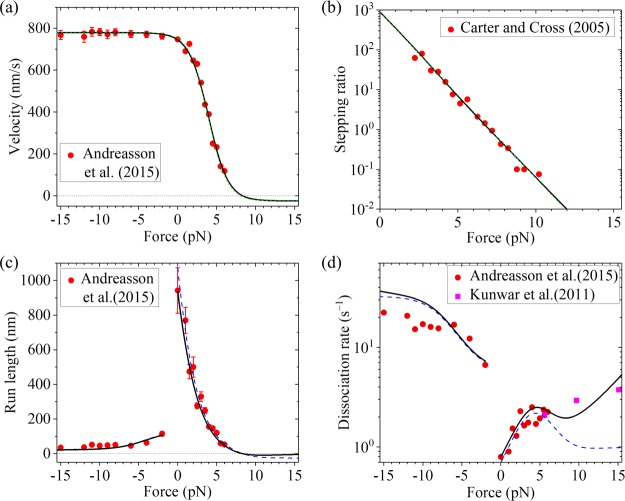
Figure 3.
Results for Drosophila kinesin at saturating ATP. (a) Velocity vs external force. The black solid line denotes the theoretical results calculated with more precise eq 7, and the green dashed line denotes the theoretical results calculated with simpler eq 10. Since the green dashed line is almost coincident with the black solid line, the two lines are almost indistinguishable. Symbols denote experimental data from Andreasson et al.17 (b) Stepping ratio vs external force. The black solid line denotes the theoretical results calculated with more precise eq 5, and the green dashed line denotes the theoretical results calculated with simpler eq 8. Since the green dashed line is almost coincident with the black solid line, the two lines are almost indistinguishable. Symbols denote experimental data from Carter and Cross16 (adapted with permission from Springer Nature). (c) Run length vs external force. The dashed blue line denotes the theoretical results calculated by considering that the motor can only dissociate in the weak MT-binding state, and the black solid line denotes the theoretical results calculated by considering that the motor can dissociate in both the weak and strong MT-binding states with εs0 = 0.1 s–1. Since the dashed blue line is almost coincident with the black solid line at F < −2 pN, the two lines at F < −2 pN are almost indistinguishable. Symbols denote experimental data from Andreasson et al.17 (d) Dissociation rate vs external force. The dashed blue line denotes the theoretical results calculated by considering that the motor can only dissociate in the weak MT-binding state, and the black solid line denotes the theoretical results calculated by considering that the motor can dissociate in both the weak and strong MT-binding states with εs0 = 0.1 s–1. Symbols denote experimental data from Andreasson et al.17 (circles) and from Kunwar et al.22 (squares).

