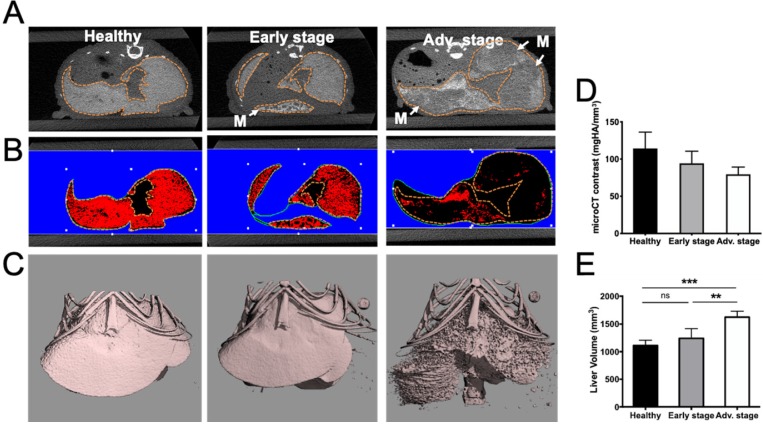
Figure 2.
Alteration of liver uptake at various stages of liver metastasis development as observed by microCT imaging after intravenous injection of alkaline earth-metal-based nanoparticles (Exitron Nano6000). A) Transversal section of the liver. Doted lines indicate the liver outline. Tumors are flagged by white “M” and arrows. B) Color-coded contrast-based segmentation highlighting contrast agent uptake in healthy tissues (red). C) 3D contrast-agent-based segmentation of the liver. D) 3D quantification of liver contrast reporting the proportion of healthy tissue within the whole liver. E) Liver volume measured from contrast-based segmentation. n= 3 mice (healthy group), n= 6 mice per group (Early and Advanced); statistical analyses: one-way ANOVA tests were used (*p-value<0.05; **p-value<0.01; ***p-value<0.001; ****p-value<0.0001).

