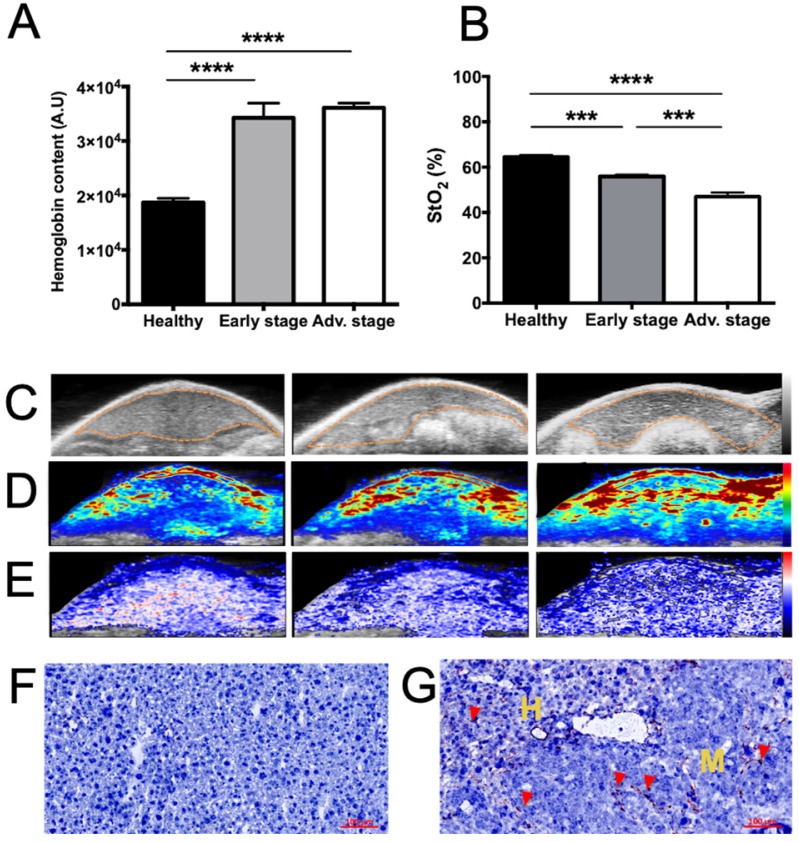
Figure 3.
Tumor-related angiogenesis and hypoxia at various stages of liver metastasis development as observed via contrast-agent-free 3D photoacoustic measurements. 3D analyses of endogenous photoacoustic signals of the whole liver using the oxy-hemo protocol (750 and 850 nm wavelengths) for the monitoring of A) total hemoglobin content (HbT) and B) average tissue oxygen saturation (StO2). Liver sections from 3D ultrasound C) and photoacoustic imaging of D) HbT and E) StO2. The dotted line represents the ROI used for photoacoustic signal quantifications. n= 3 mice (healthy group), n= 6 mice per group (Early and Advanced); statistical analyses: one-way ANOVA tests were used (*p-value<0.05; **p-value<0.01; ***p-value<0.001; ****p-value<0.0001). Close-up look on F) healthy and G) metastasized tissues after CD31 labelling. Positive coloration is indicated by red arrows. Yellow “H” and “M” mentions refers to healthy and metastatic tissues respectively.

