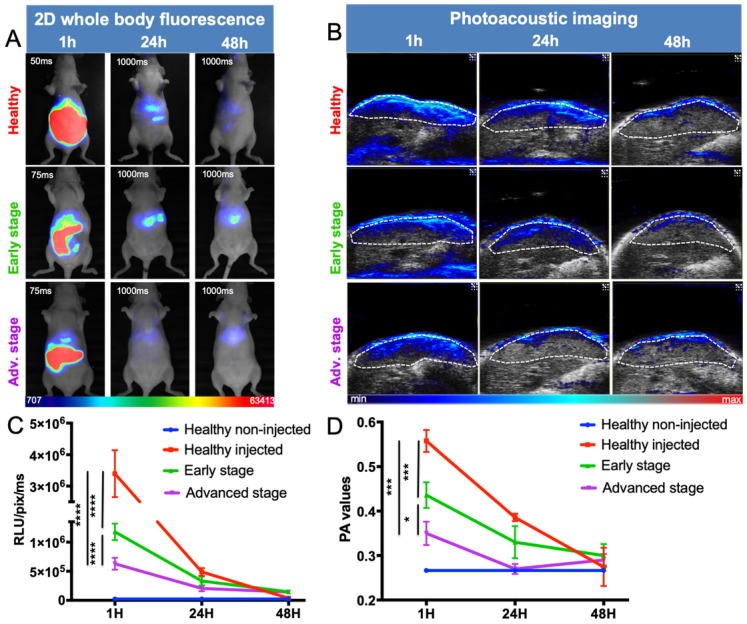
Figure 6.
In vivo distribution kinetics of ICG at various stages of liver metastasis development by fluorescence and photoacoustic imaging. A) 2D whole-body fluorescence imaging 1h, 24h and 48h after intravenous injection of ICG at various stages of liver metastasis development. Fluorescence signals being highly different between early and late time points, the images were taken with optimized exposure time. B) Liver sections from 3D ultrasound and photoacoustic imaging (800 nm). The dotted white line represents the ROI used for photoacoustic signal quantifications. C) Kinetics of fluorescence and D) photoacoustic signals from the liver. n= 3 mice (healthy group), n= 6 mice per group (Early and Advanced); statistical analyses: two-way ANOVA tests were used (*p-value<0.05; **p-value<0.01; ***p-value<0.001; ****p-value<0.0001).

