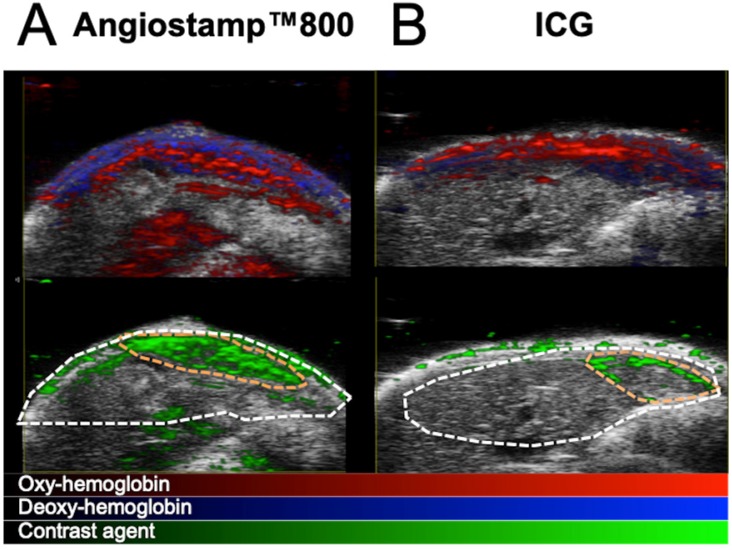
Figure 9.
In vivo mapping of oxyhemoglobin, deoxyhemoglobin and tracer distribution by multispectral photoacoustic imaging. Liver sections from 3D ultrasound and multispectral photoacoustic imaging with Angiostamp800 (A) or ICG (B) injected 24 hours or 1 hour before imaging, respectively (red: oxyhemoglobin, blue: deoxyhemoglobin, green: Angiostamp800 or ICG).

