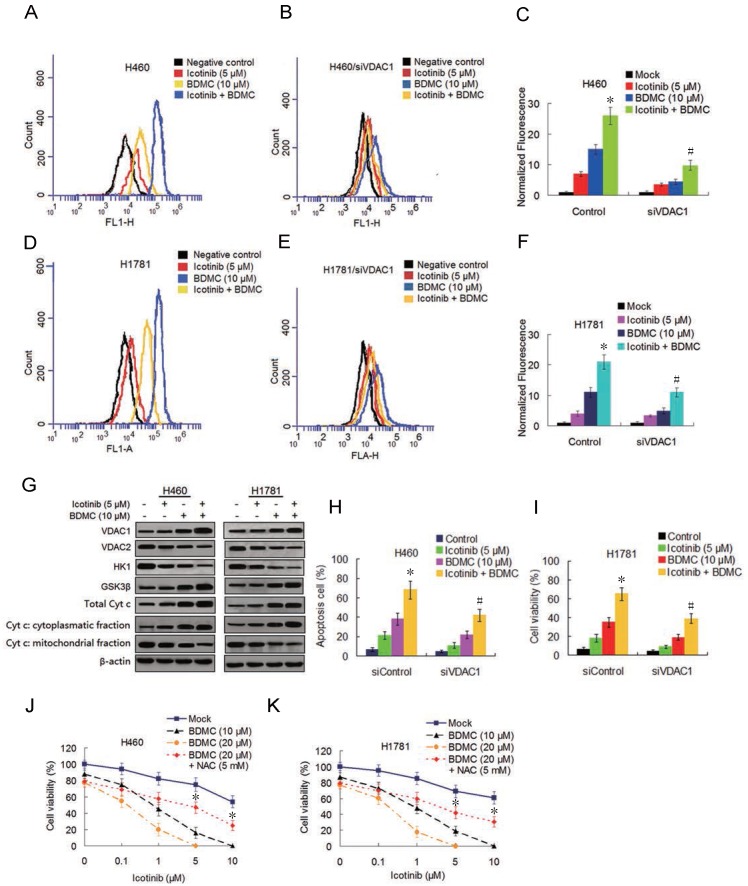
Figure 3.
Icotinib plus BDMC activates ROS generation and modulates VDAC and mitochondrial homestasis. (A and D) Before and (B and E) after transfection with siVDAC1, H460 and H1781 cells were treated with icotinib and/or BDMC at indicated doses for 48 h and induction of ROS was measured by BD Accuri CFlow software (ACFS), as described in Materials and Methods. The intensity of ROS fluorescence in Mock treated control was defined as 1. (C and F) The quantative analysis of the intensity of ROS fluorescenceof. *P < 0.05 versus icotinib or BDMC; # P < 0.05 vs icotinib + BDMC in Control. (G) H460 and H1781 cells were treated with icotinib and/or BDMC at indicated doses for 48 h, and subjected to immunoblot assay to determine the protein expressions indicated. (H and I) After tranfection with siVDAC1 or siControl, H460 and H1781 cells were treated with icotinib and/or BDMC at indicated doses for 48 h, then flow cytometry was carried out to determine the percentage of apoptotic cells. *P < 0.05 vs icotinib or BDMC, # P < 0.05 versus icotinib + BDMC in Control. (J and K) H460 and H1781 cells were treated with icotinib alone, or icotinib plus BDMC at indicated doses, or the two combination plus NAC at indicated doses for 48 h, cell viability was determined by CCK-8 assay. *P < 0.05 vs BDMC 20 µM.

