Figure 1.
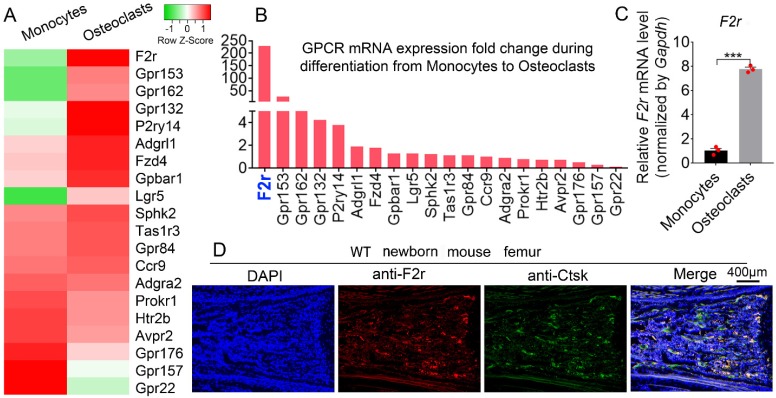
F2r is highly expressed in osteoclasts. (A) Heatmap for 20 GPCRs expression in wild type mouse bone marrow monocytes (MBMs) and osteoclasts induced by M-CSF (10 ng/ml) and RANKL (10 ng/ml) from RNA-seq analysis. (B) Fold change of GPCRs mRNA expression in monocytes and osteoclast from RNA-seq data. (C) qRT-PCR analysis of F2r mRNA expression in monocytes and osteoclasts by compared with Gapdh. One dot represents one sample (n=3). (D) Immunofluorescence (IF) stain of anti-F2r (red) and anti-Ctsk (green) on new born wild type (WT) mouse femur section. Results are presented as mean ± SEM of triplicate independent samples. ***p<0.001.

