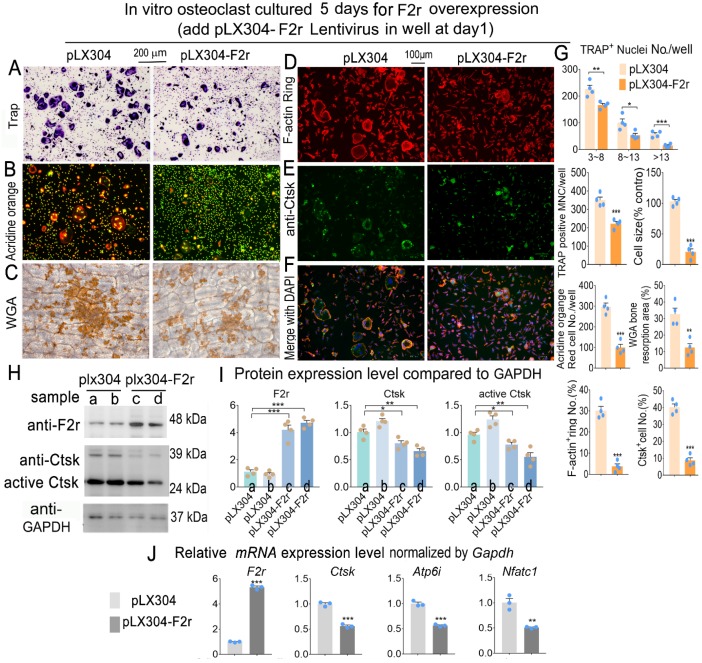
Figure 3.
F2r overexpression inhibited osteoclastogenesis. (A) TRAP stain and (B) Acridine orange stain of pLX304 and pLX304-F2r infected MBMs that induced 5 days by M-CSF and RANKL. (C) Wheat germ agglutinin (WGA) stain analysis of osteoclast on bone slices to detect bone resorption area of induced MBMs. (D) Fluorescence microscopy of F-actin ring stain and (E) anti-Ctsk immunofluorescence (IF) stain in mature osteoclasts. (F) Overlap of D, E was detected as a yellow-orange area in the merged image. (G) Quantification data of A-F. (H) Western blot of F2r and Ctsk protein expression level in pLX304 (a,b) and pLX304-F2r (c,d) infected osteoclasts. GAPDH was used as a control. Protein expression level in pLX304 group normalized as 1. (I) Quantification data of H. (J) qRT-PCR was carried out to measure F2r, Ctsk, Atp6i and Nfatc1 mRNA levels relative to Gapdh in osteoclasts. One dot represents one sample. Results are presented as mean ± SEM; n≥3. *p<0.05, **p<0.01, ***p<0.001.

